Key Points:
- Gold nears bottom of channel.
- RSI trending lower within neutral territory.
- Parabolic SAR indicating further bearishness ahead.
Gold has largely been a net beneficiary of a weakening US dollar over the past few weeks as the metal initially roared and formed a new high around the $1367.08 mark.
However, since that point the highs are forming lower and price action has been retreating as the shine starts to rub off the short term rally. Subsequently, the metal could be in for a torrid time as the bottom of the channel nears and all signs point to a breakdown.

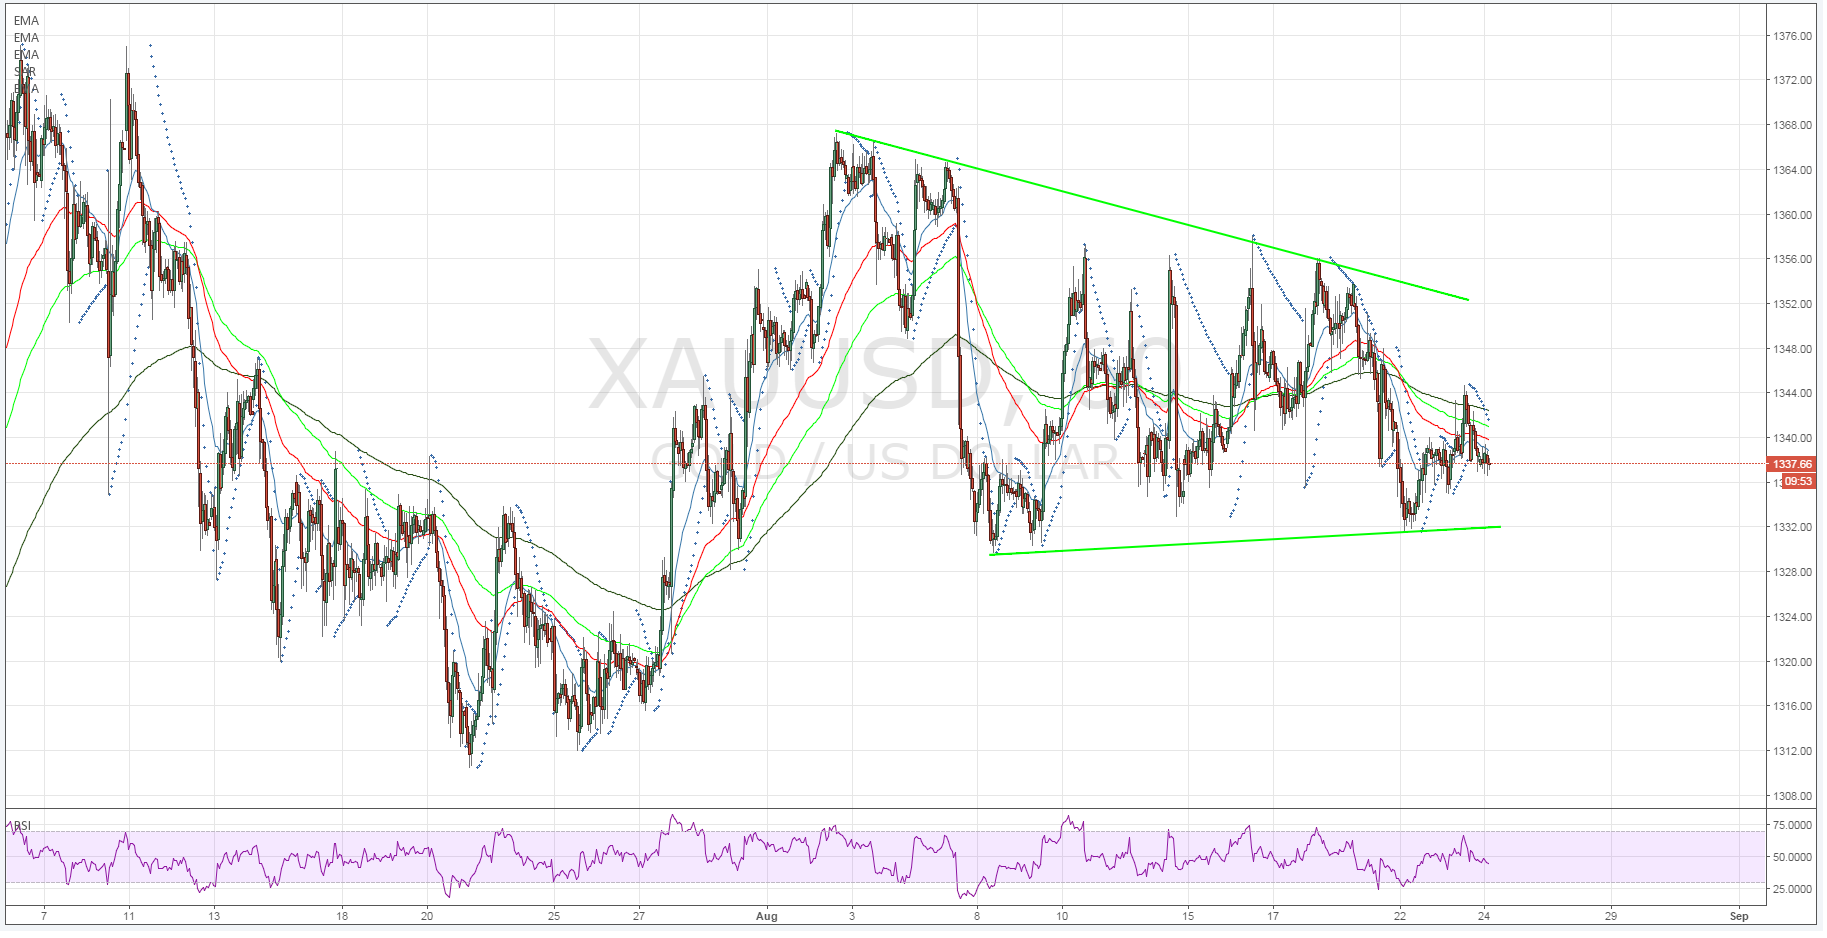
A quick perusal of gold’s hourly chart clearly demonstrates the recent trend with price action largely having been in decline since early August. In fact, the current trend has seen gold dive from a high of $1367.08 an ounce to currently trade around the $1337.38 mark. However, the past 24 hours has seen price action moving convincingly back below the 200 and 100 hour EMA’s.
In fact, from a technical perspective, the yellow metal is highly predisposed to another bearish leg given that RSI continues to trend lower from within neutral territory. Additionally, the parabolic SAR has also moved to the bearish side and is following price action lower towards the bottom of the channel at the $1332.50 mark.
Subsequently, looming support around the $1332 mark is likely to be the key battle ground over the next few days. The reversal zone has seen at least four swing candles over the past month but a breach of this point would be disastrous for the metal with the next strong support level falling around the $1323.00 mark.

Ultimately, if gold does indeed challenge and breach the bottom of the short term channel, we are likely to see some highly bearish moves from gold over the next few days.
However, there is plenty of scope for fundamental volatility in the latter part of this week as Fed Chair Yellen is due to speak and the potential for future rate hikes is likely to be a key theme and subsequently impact gold.
