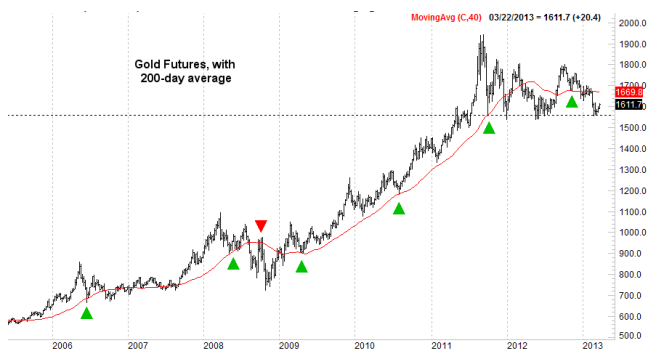
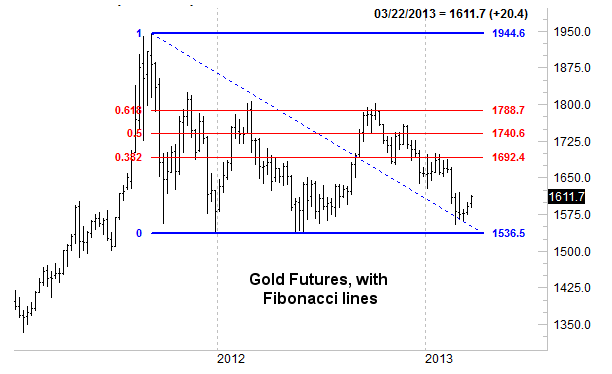
The $1,556-per-ounce mark was, and still is a major support level that extends all the way back to September 2011. Although the sellers tested that line last month, they didn’t cross it. There’s another big floor at $1,530 that wasn’t even tested at all. In fact, the support at $1,556 ended up being a pushoff point for the current rally. The question is, how much more upside is left to unfurl now that gold’s floor held up? Answer: approximately another 4.2%, or roughly $70 per ounce. That would put gold prices back somewhere in the vicinity of $1,680.
That’s not a number I randomly pulled out of a hat. That’s nearly a couple of key technical resistance lines that like it or not, do matter.
The first ceiling is the key 200-day moving average line, which currently is at $1,670. As you can see on the nearby chart, although not every major top or bottom for gold has formed at the 200-day line, too many have to dismiss it as a resistance level now.
The other big ceiling that could cap this rally effort is the Fibonacci retracement level around $1,692. That’s a 38.2% retracement of the big pullback from 2011’s peak of $1,944 to 2012’s low of $1,537. It might seem a bit arbitrary, but Fibonacci lines do a surprisingly good job at figuring out the market’s natural “uncle” points. We shouldn’t dismiss their effect.
Between the Fib line and the 200-day line, there’s plenty that could get in the way around the $1,680 mark. There’s not a lot that could stop the rally between here and there.
If you’re not a futures trader or prefer something more conventional like an ETF, then the technical ceiling for the SPDR Gold Shares (NYSE:GLD) ETF is around $162, where its 38.2% Fibonacci retracement line and 200-day MA are close to intersecting.
Alhough the technical look might seem short-term, this is ultimately part of a long-term look at gold’s changing fundamentals. And those long-term fundamentals are still leaning bearishly.
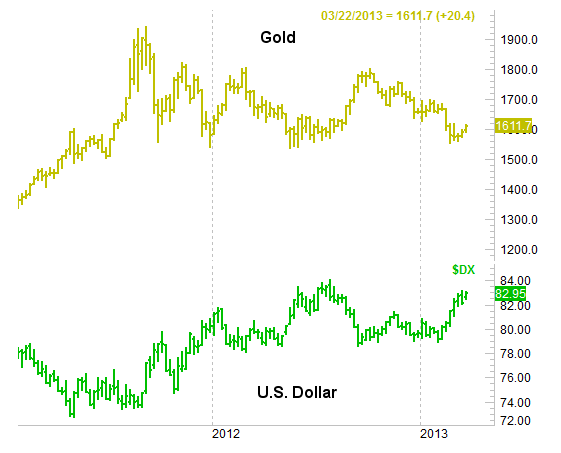
When all is said and done, gold prices are mostly driven by the U.S. dollar. If U.S. dollar rises, gold may slump. If the U.S. dollar slumps, gold price rises. There are other factors that push and pull gold prices (like inflation, and consumption), but by and large, gold is driven by the greenback.
The U.S. dollar index actually is higher now than it was a couple of weeks ago, and is close to new multi-month highs. For all intents and purposes, this is backward.
One could argue that gold actually is leading the dollar, meaning sooner or later, the U.S. dollar index will fall to reflect the rise in gold’s prices. That’s a very stretched assumption, as that is rarely the way it happens.
And yes, the dollar is more likely to keep rising than to fall again.
The so-called currency war that began about a month ago is ultimately designed to make other currencies weak, which makes the U.S. dollar relatively stronger. At the same time, there’s nothing in the United States’ current fiscal policy that’s likely to put downward pressure on the dollar’s value anytime soon. Translation: There’s nothing the Fed could plausibly do from here, that would actually push the U.S. dollar index lower again, especially given how intent other nations - especially in eastern Asia - are on keeping their export business strong by keeping their currency weak.
Bottom line: Gold is in a long-term downtrend, but you still want to pick and choose your spots.
- English (UK)
- English (India)
- English (Canada)
- English (Australia)
- English (South Africa)
- English (Philippines)
- English (Nigeria)
- Deutsch
- Español (España)
- Español (México)
- Français
- Italiano
- Nederlands
- Português (Portugal)
- Polski
- Português (Brasil)
- Русский
- Türkçe
- العربية
- Ελληνικά
- Svenska
- Suomi
- עברית
- 日本語
- 한국어
- 简体中文
- 繁體中文
- Bahasa Indonesia
- Bahasa Melayu
- ไทย
- Tiếng Việt
- हिंदी
Gold’s Long-Term Fundamentals Still Leaning Bearishly
Published 03/21/2013, 06:49 AM
Updated 05/14/2017, 06:45 AM
Gold’s Long-Term Fundamentals Still Leaning Bearishly
Latest comments
Loading next article…
Install Our App
Risk Disclosure: Trading in financial instruments and/or cryptocurrencies involves high risks including the risk of losing some, or all, of your investment amount, and may not be suitable for all investors. Prices of cryptocurrencies are extremely volatile and may be affected by external factors such as financial, regulatory or political events. Trading on margin increases the financial risks.
Before deciding to trade in financial instrument or cryptocurrencies you should be fully informed of the risks and costs associated with trading the financial markets, carefully consider your investment objectives, level of experience, and risk appetite, and seek professional advice where needed.
Fusion Media would like to remind you that the data contained in this website is not necessarily real-time nor accurate. The data and prices on the website are not necessarily provided by any market or exchange, but may be provided by market makers, and so prices may not be accurate and may differ from the actual price at any given market, meaning prices are indicative and not appropriate for trading purposes. Fusion Media and any provider of the data contained in this website will not accept liability for any loss or damage as a result of your trading, or your reliance on the information contained within this website.
It is prohibited to use, store, reproduce, display, modify, transmit or distribute the data contained in this website without the explicit prior written permission of Fusion Media and/or the data provider. All intellectual property rights are reserved by the providers and/or the exchange providing the data contained in this website.
Fusion Media may be compensated by the advertisers that appear on the website, based on your interaction with the advertisements or advertisers.
© 2007-2025 - Fusion Media Limited. All Rights Reserved.
