Key Points:
- Near-term slip is forecasted if the current resistance level holds firm.
- Technical bias is near-term bearish but long-term bullish.
- Fundamentals should inspire a rally after the forecasted tumble.
Gold is fast approaching a critical resistance level which could mean we have a few torrid weeks ahead of us. Specifically, on the one hand, the metal’s underlying bullish sentiment remains intact which should see it push higher. However, on the other hand, gold is battling against a deteriorating technical bias which might necessitate a slip to the downside in the coming days. As a result, we may need to take a closer look at the metal to get a clearer picture of what is going on.
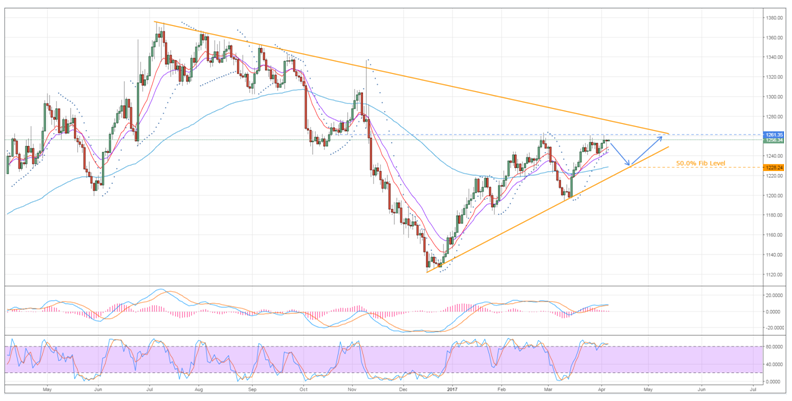
Firstly, we need to understand whether the bears or the bulls are likely to be in command of the metal in the near-term. At present, the bias seems to be in favour of the bears for a number of reasons. For one, gold prices are battling against a fairly robust zone of resistance that has previously remained unbroken. In addition to this, stochastics are overbought and the MACD is on the cusp of having a bearish signal line crossover.

The main technical arguments against near-term bearishness come from two key readings. Namely, the Parabolic SAR and the moving average bias which are both still rather bullish. However, these are unlikely to be able to counteract a swing against the metal. In the Parabolic SAR’s case, the indicator is very close to inverting and, indeed, recent price action almost did manage to cause such a switch in bias. As for the moving averages, these are more indicative of long-term bullishness and, therefore, are unlikely to present a major impediment to the forecasted slip.
Overall, we expect that selling pressure should see the pair move back to the 1228.24 handle prior to the downside of the pennant capping losses. A breakout past this point is not expected which is due, in part, to the presence of the 50.0% Fibonacci retracement level. Although, the 100 day EMA is likely to intersect the trend line at around this price which will further add to support. From a more fundamental perspective, losses should be limited to this level as gold’s underlying bullish sentiment remains intact. Said sentiment stems largely from increasing uncertainty in the market place, evidenced by the VIX whose average reading has been creeping steadily higher over the past few months.
As a result of this mixed sentiment, we would expect to see a rather sizable recovery for gold once it has tested the ascending trend line. This recovery should then extend back up to the current zone of resistance which will be intersecting the long-term descending trend line, meaning, either another reversal to the downside or a break out will be on the way fairly soon after. Unfortunately, we will have to take a look at the metal closer to this juncture before we hazard a guess at which is the more likely outcome.
Ultimately, keep an eye on gold as it has both upside and downside potential are on offer moving ahead. As mentioned, the initial plunge and subsequent rally should result from a mix of countervailing technical and fundamental forces which could see the 1228.24 mark tested within a week or so. However, monitor both the developing Brexit story and the ever-present influence of Trump as they are sure to continue to impact the metal’s performance as well.
