While we expected additional weakness in gold and gold stocks (weeks ago) we did not quite expect the kind of selling the sector experienced in the wake of Donald Trump’s election victory. The market reacted by sending bond yields dramatically higher which resulted in stronger real interest rates, which is fundamentally negative for precious metals. This has created significant technical damage in the sector and has potentially thrown the 2016 bull off course.

Gold Bull Analog
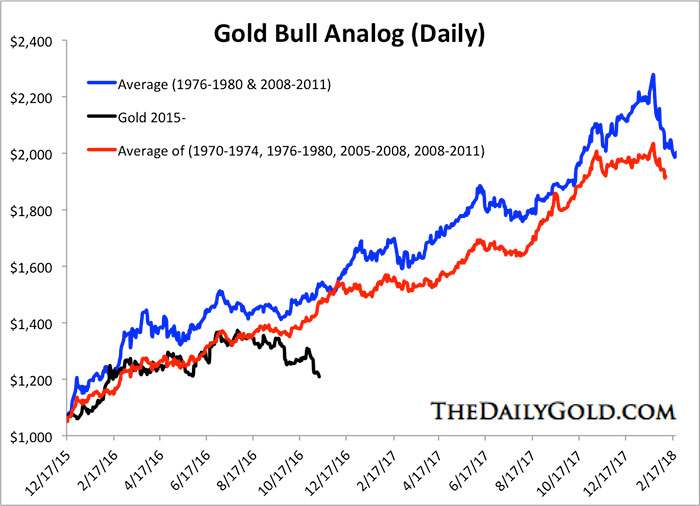
Our first chart shows how and when this bull market went off course. Below we compare the current rebound in gold to some of those from the past. As you can see, the 2016 rebound was well on course until the second half of September. That is when historical bull markets pushed higher. Unfortunately, gold broke lower and has continued to trade lower. It has diverged from its bull market course.
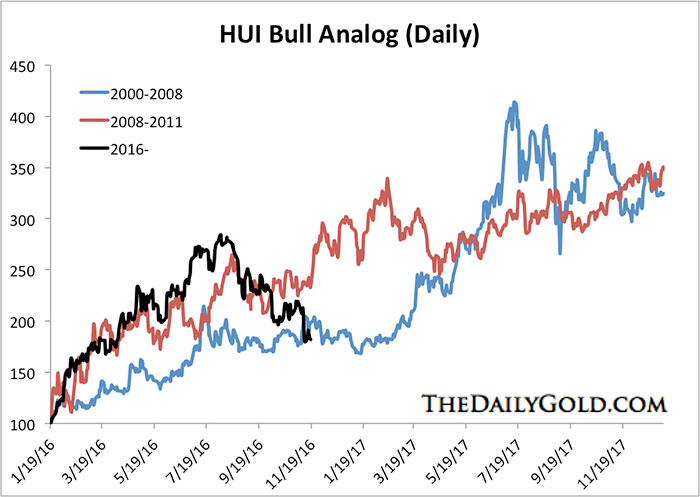
Our next chart pertains to the bull market in gold stocks and specifically the HUI Gold Bugs Index. The chart shows that this needs to be an important low for the bull market to remain intact. While I expect a rebound very soon, I have some doubts that the low will hold.

HUI Bull Analog
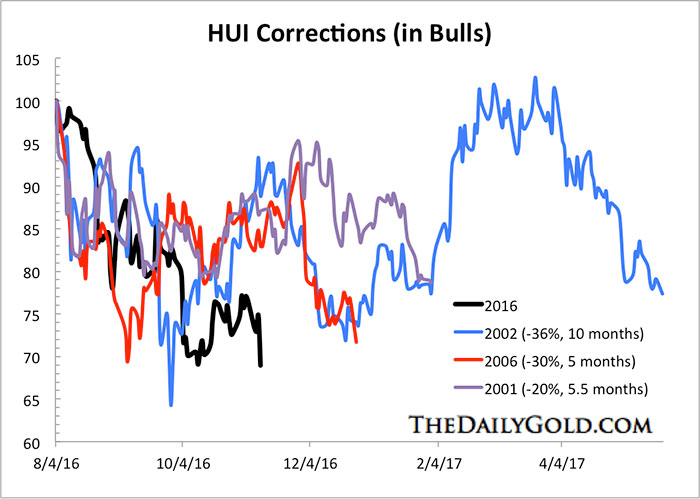
Next we compare the current correction in the HUI to past bull market corrections. Like the last analog, this one shows the gold stocks need to begin a big rebound for their bull market to remain intact. Both analogs show that the gold stocks cannot go lower from here if they are to remain in a bull market.

HUI Correction Analog
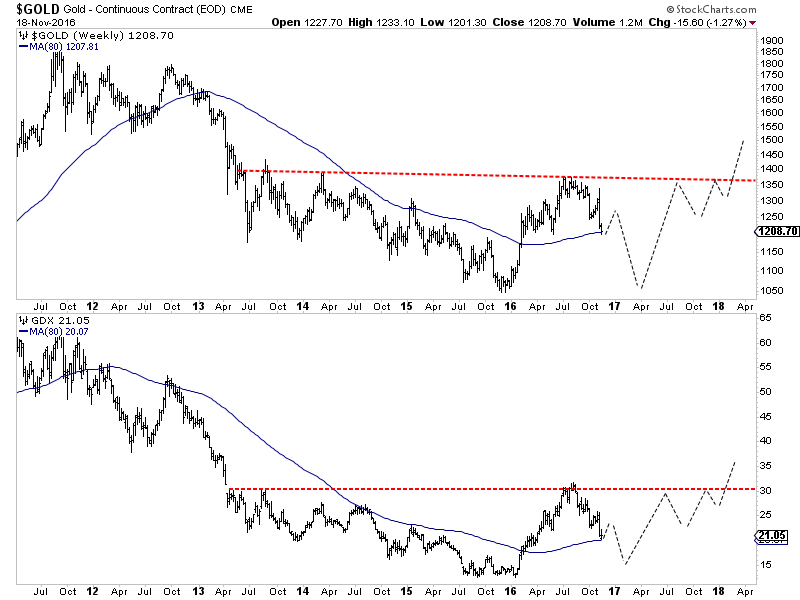
Both history and current price action argue that gold and gold stocks are at risk of a big decline if they lose the current lows. If gold loses $1200/oz then it could drop quickly to $1080/oz or even $1050/oz, the major low. The same can be said for GDX (NYSE:GDX) which bounced from its 62% retracement and 80-week moving average at $20. Below I have sketched out how this bearish scenario could play out. Note, this sketch is purely subjective and subject to change.

Unless gold and gold stocks hold current levels and form an important low then the 2016 bull market has gone off course. At present, the evidence favors the bearish scenario which has the sector trading lower in the months ahead. We could chalk this up to a fundamental change (which I consider to be temporary) coupled with the potential for a spike in the US dollar. Investors are advised to de-risk their portfolios during the coming rebound and prepare for a better buying opportunity at the end of winter.
