I have often described gold as nothing more than a shiny yellow rock. From a functionality perspective I still believe this. But that rock does have a lot of history attached to it. And that history, thousands of years of it, gives it a great allure. As humans we cannot completely ignore that. Our brains do not work that way.
And as an investor, it is even harder to ignore. Gold gets put forth as a hedge for inflation, a safety play in times of trouble and a commodity play. Whether that's true is irrelevant to a technical trader. All that matters is the price action. And gold's price action has been great.

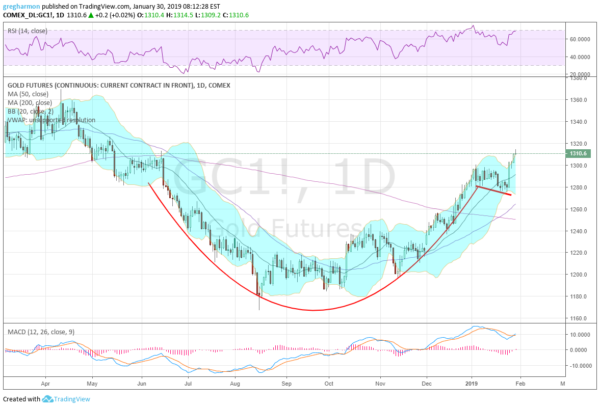
Take a look at the chart above. It shows the price of gold over the last 12 months. From the consolidation under the 200-day SMA in June, it moved lower to a bottom in August. The price held there, in a pretty flat consolidation into early October. Since then, though, the price has been rising.
It was a bit choppy at first, going back to retest the consolidation in November but then it moved higher. Gold then stalled at the end of the year, completing a better than 6-month Cup. Most of January was then a consolidation in a bull flag, completing the Handle of the pattern. Earlier this week it broke to the upside, triggering the pattern.
Price Target (NYSE:TGT)
The target for the cup-and-handle is a move in price to 1415. That is almost 9% above the current price. Momentum supports more upside for gold with the RSI rising and strong in the bullish zone and the MACD crossing back up and positive. And the Bollinger Bands® are opening to allow a move higher.
There is a lot of past price action from 1345 to 1365 to work through so it may pause or stall there. But if it can get through that, there has been little history up to 1400 over the past 5 years.
