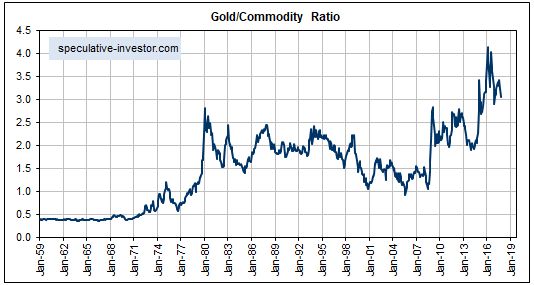
The following monthly chart shows that relative to a broad basket of commodities*, gold commenced a very long-term bull market (47 years and counting) in the early-1970s. It’s not a fluke that this bull market began at the same time as the final official USD-gold link was severed and the era of irredeemable free-floating fiat currency kicked off.

Anyone attempting to apply a traditional commodity-type analysis to the gold market would have trouble explaining the above chart. This is because throughout the ultra-long-term upward trend in the gold/commodity ratio the total supply of gold was orders of magnitude greater, relative to commercial demand, than the supply of any other commodity. Based on the sort of supply-demand analysis that routinely gets applied to other commodities, gold should have been the worst-performing commodity market.
The reason that a multi-generational upward trend in the gold/commodity ratio began in the early-1970s and is destined to continue is not that gold is money. The reality is that gold no longer satisfies a practical definition of money. The reason is the combination of the greater amount of mal-investment enabled by the post-1970 monetary system and the efforts by central bankers to dissuade people from saving in terms of the official money.
In brief, what happens is this: Central banks put downward pressure on interest rates (by creating new money) in an effort to promote economic growth, but the economy’s prospects cannot be improved by falsifying the most important price signals. Instead, the price distortions lead to clusters of ill-conceived investments, thus setting the stage for a recession or economic bust. Once it is widely realised that cash flows are going to be a lot less than previously expected, there is a marked increase in the general desire to hold cash. At the same time, however, central banks say that if you hold cash then we will punish you. They don’t use those words, but it is made clear that they will do whatever it takes to prop-up prices and prevent the savers of money from earning a real return on their savings. This prompts people to look for highly liquid assets that can be held in lieu of the official money, which is where gold comes in.
This is why the gold/commodity ratio tends to trend downward when everything seems fine on the surface and rocket upward when it becomes apparent that numerous investing mistakes have been made and that the future will be nowhere near as copacetic as previously assumed.
It’s reasonable to expect that the multi-generational upward trend in the gold/commodity ratio that began in the early-1970s will continue for at least as long as the current monetary system remains in place. Why wouldn’t it?
*For the broad basket of commodity prices the chart uses the CRB Index up to 1992 and the GSCI Spot Commodity Index (GNX) thereafter.
