
A year ago, in March 2018, the Goldman Sachs (NYSE:GS) stock climbed to an all-time high of over $275 per share. Unfortunately for the trend-followers, the rest of the year was nothing short of disastrous. GS dipped below $152 in December before closing the year at $167.05 for a total annual loss of 35.2%.
The stock finished at $188.96 last week after the bulls’ ambitions were rejected by the resistance near $206. Goldman Sachs is a financially strong and very profitable company, but that did not prevent the collapse in its stock price last year. Apparently, the fundamentals don’t tell the whole picture.
In order to find out what the recovery from $152 really means we need to examine its Elliott Wave structure. Take a look at it on the hourly chart below:
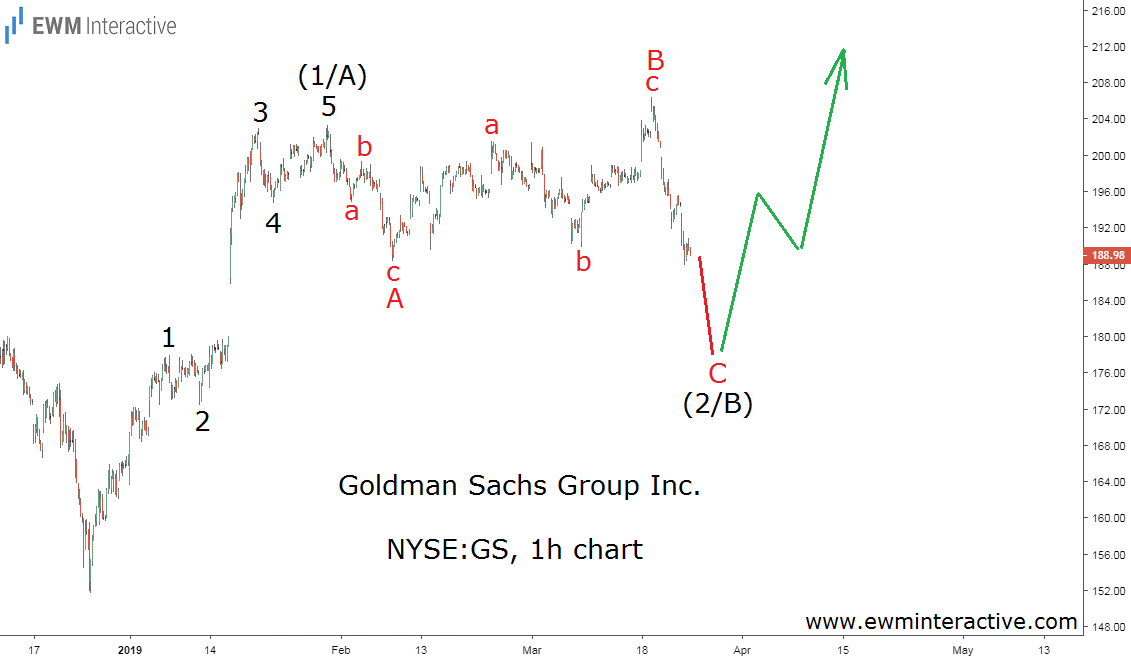
The sharp recovery from $151.70 to $203.29 can be seen as a five-wave impulse in wave (1/A), labeled 1-2-3-4-5. The Elliott Wave theory states that a three-wave correction in the opposite direction follows every impulse. In Goldman’s case, wave (2/B) looks like an A-B-C expanding flat retracement.
Waves A and B are simple a-b-c zigzags, while wave C is still in progress. If this count is correct, once wave C completes the 5-3 wave cycle the trend can be expected to resume in the direction of the impulsive sequence. Targets above $210 a share make sense in the mid-term unless the price drops to a new low below $152.
In addition, traditional valuation ratios such as P/B and P/E also suggest Goldman Sachs is currently undervalued. When technical and fundamental methods both point in the same direction, it’s a risk worth taking.