
Driven by increase in net revenues in equity securities, The Goldman Sachs Group, Inc.’s (NYSE:GS) second-quarter 2017 results recorded a positive earnings surprise of 17.6%. The company reported earnings per share of $3.95, beating the Zacks Consensus Estimate of $3.36. Further, the bottom line witnessed 6% year-over-year improvement.
Results were primarily driven by higher equities revenues and low expenses. However, lower fixed income revenues were a headwind. Notably, the quarter witnessed challenging market-making environment, reduced levels of volatility and low client activity levels.
Shares of Goldman lost more than 1% in the pre-market trading. Perhaps, lesser support on the fixed income revenues led to investors’ bearish stance. Nonetheless, the actual picture will emerge in the full day’s trading session, with investors and analysts considering the core results.
Net earnings of $1.83 billion reflected a slight increase from the prior-year quarter.
Solid Revenues in Equity Securities & Low Expenses
Goldman’s net revenue edged down 1% year over year to $7.89 billion in the quarter under review. However, revenues outpaced the Zacks Consensus Estimate of $7.57 billion.
Quarterly revenues, as per business segments, are as follows:
The Institutional Client Services division recorded revenues of $3.1 billion, down 17% year over year. The fall indicated lower net revenues in Fixed Income, Currency and Commodities Client Execution revenues (down 40% year over year), adversely affected by lower revenues from interest rate products, commodities, currencies and credit products, partially offset by high revenues in mortgage products.
However, rise in commissions and fees, along with securities services and equities client execution, resulted in the gain in Equities revenues (up 8%).
The Investment Banking division generated revenues of $1.7 billion, down 3% year over year. Results displayed lower debt and equity underwriting revenues, indicating 1% year-over-year decline in total underwriting fees. Further, lower financial advisory revenues (down 6%) were recorded, affected by the decreased number of completed industry-wide transactions during the quarter.
The Investment Management division recorded revenues of $1.5 billion, up 13% year over year. The growth was mainly driven by higher incentive and transaction fees, along with management and other fees.
The Investing and Lending division’s revenues of $1.6 billion in the quarter were significantly higher on a year-over-year basis. The rise was aided by surge in revenues from investments in equities, partially offset by lower revenues in debt securities and loans.
Total operating expenses decreased 2% year over year to $5.4 billion. Expenses moved down mainly due to decline in compensation and employee benefits expenses (down 3%).
Non-compensation expenses were almost flat compared with the prior-year quarter. Expenses included elevated level of brokerage, clearing, exchange and distribution fees, market development expenses, along with depreciation and amortization expenses, mostly offset by reduced other expenses, driven by lower net provisions for litigation and regulatory proceedings.
Strong Capital Position
Goldman exhibited a robust capital position in the reported quarter. As of Jun 30, 2017, the company’s Common Equity Tier 1 ratio was 12.5% under the Basel III Advanced Approach, highlighting the valid transitional provisions. The figure was down from 12.9% recorded in the prior quarter. The company’s supplementary leverage ratio on a fully phased-in basis was 6.3% at the end of the second quarter, down from 6.4% recorded in the prior quarter.
Adjusted return on average common shareholders’ equity, on an annualized basis, was 8.7% in the reported quarter.
Capital Deployment Update
During second-quarter 2017, the company repurchased 6.6 million shares of its common stock at an average price per share of $221.92 and a total cost of $1.47 billion.
Conclusion
Results of Goldman highlight an impressive quarter. The company’s well-diversified business, apart from its solid investment banking operations, continues to ensure earnings stability. Its focus to capitalize on new growth opportunities through several strategic investments, including the digital consumer lending platform, should bolster overall business growth. However, costs stemming from unresolved litigations remain near- to medium-term headwinds.
Goldman Sachs Group, Inc. (The) Price, Consensus and EPS Surprise
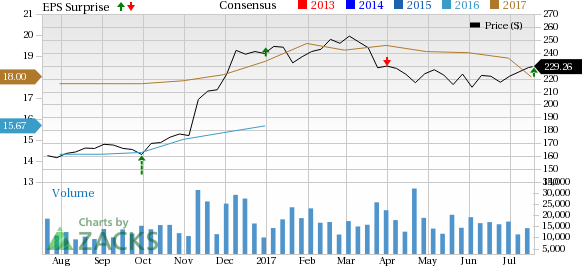
Goldman Sachs Group, Inc. (The) Price, Consensus and EPS Surprise | Goldman Sachs Group, Inc. (The) Quote
Currently, Goldman carries a Zacks Rank #4 (Sell).
You can see the complete list of today’s Zacks #1 Rank (Strong Buy) stocks here.
Performance of other Major Banks
Higher interest income drove Wells Fargo & Company’s (NYSE:WFC) second-quarter 2017 earnings which recorded a positive surprise of about 4.9%. Earnings of $1.07 per share outpaced the Zacks Consensus Estimate of $1.02. Moreover, the figure compared favorably with the prior-year quarter’s earnings of $1.01 per share.
Citigroup Inc. (NYSE:C) delivered a positive earnings surprise of 5.0% in second-quarter 2017, riding on higher revenues. The company’s income from continuing operations per share of $1.27 for the quarter outpaced the Zacks Consensus Estimate of $1.21. Also, earnings compared favorably with the year-ago figure of $1.25 per share.
Rising interest rates and loan growth drove JPMorgan Chase & Co.’s (NYSE:JPM) second-quarter 2017 earnings of $1.82 per share, which easily surpassed the Zacks Consensus Estimate of $1.57. Also, the figure reflects a 17% rise from the year-ago period. Notably, the results included a legal benefit of $406 million.
5 Trades Could Profit "Big-League" from Trump Policies
If the stocks above spark your interest, wait until you look into companies primed to make substantial gains from Washington's changing course.
Today Zacks reveals 5 tickers that could benefit from new trends like streamlined drug approvals, tariffs, lower taxes, higher interest rates, and spending surges in defense and infrastructure. See these buy recommendations now >>
J P Morgan Chase & Co (JPM): Free Stock Analysis Report
Wells Fargo & Company (WFC): Free Stock Analysis Report
Citigroup Inc. (C): Free Stock Analysis Report
Goldman Sachs Group, Inc. (The) (GS): Free Stock Analysis Report
Original post
Zacks Investment Research