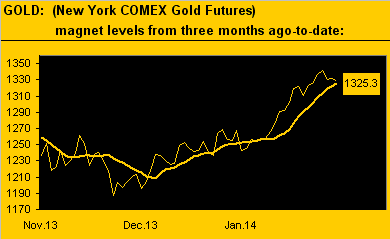
The dare-I-say duplicitous side of the analyst is that given time, an expectation indeed repeated time and again shall eventually pan out, (the collateral damage endured en route notwithstanding). 'Tis been two weeks now since our expectations for a natural near-term pullback in the price of Gold were put forth and we're just now beginning to actually see it -- barely. But one cannot fool Ms. Marché: Gold settled Friday at 1329, which obviously is still higher that 'twas two weeks ago (1319). Yet price did run out of puff on Wednesday at 1346, is now 15 points lower, and the expected return to the Market Magnet -- which has of its own accord been rising throughout and is now up to 1325 -- has all but been achieved. (Again, the boxed magnet below is a "contract volume price-weighted average" drawn from the data that derive Gold's Market Profile bars at which we'll later look). Here are the last three months-to-date:
Big deal, eh? The truly big deal is that Gold has now traded as high as 13.9% above its 31 December low of 1181, (the S&P -- despite its FinMedia glorification -- as much as just 1.4% over the exact same time frame), and with each passing week one can sense further reinforcement that Gold's worst days for the foreseeable future are behind it. We're not putting forth that Gold's run through here is overly powerful, for indeed our calculation of its EDTR (expected daily trading range) has been notably narrowing :
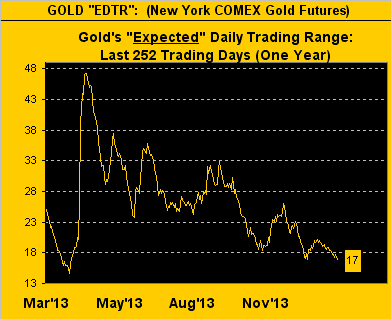
Indeed, 'tis sufficiently shrunk such that one might expect volatility to increase. But either way, our stance remains for Gold to only mildly correct near-term (1290-1275) before moving more broadly onward in seek of 1466 (the bottom of "The Floor") perhaps by mid-year. Here's our three-point rationale for both cases, (down, then up).
Gold lower near-term because:
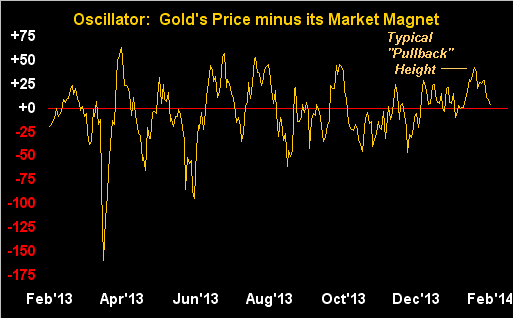
1) A return by price to its Market Magnet as shown at the outset generally brings with it further downside below the magnet. The following chart, (wherein the horizontal red line is essentially the magnet), is simply the oscillator of Gold minus magnet from a year-ago-to-date. (And notice how out-of-sorts the selling became in April and June last year):
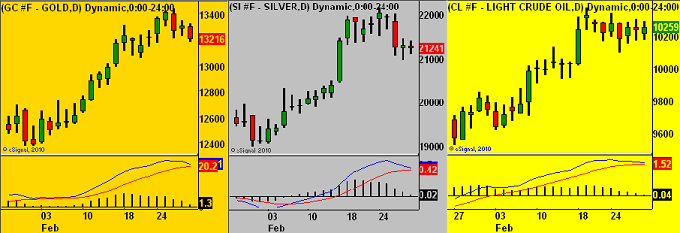
2) Both Gold and Silver, as well as Oil, are quite close to negative crossings per the respective MACDs (moving average convergence divergences) on their daily bars. This suggests we may see some pressure on commodities at large near-term:
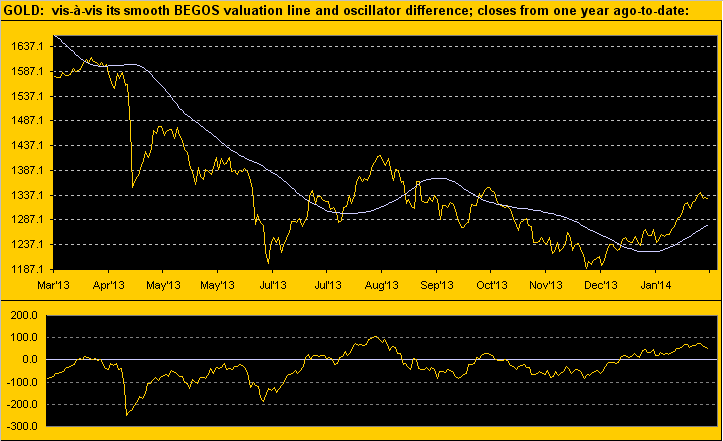
3) Gold's price has been riding above its smooth pearly valuation line, (a computation based upon Gold's movement relative to those of the markets that comprise BEGOS: Bond/Euro/Gold/Oil/S&P), for 34 consecutive days, something we've not seen since late summer 2012 when it went on a 44-day run above value. Not that it can't keep going, however similar to the Market Magnet phenomenon, price at some point returns to, indeed crosses through, value. Here's the full year-over-year view:
Enough over our near-term concerns for a bit of ebb. Let's now turn to future flow.
Gold higher more broadly because:
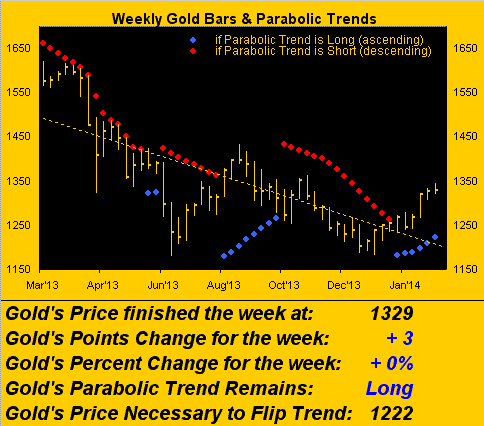
1) Never to be left out of The Gold Update, here are the weekly bars and furtherance of the Long parabolic trend. Why we've even a blue dot above the dashed regression trendline. And as noted in the stats below this popular graphic, Gold would have to drop to as deep as 1222 in the ensuing week to flip the parabolic trend to Short; thus there is plenty of room to accommodate our anticipated near-term pullback without upsetting the applecart. 'Tis prudent however to also note the stubbiness of the last two bars with respect to the narrowing EDTR chart presented earlier:
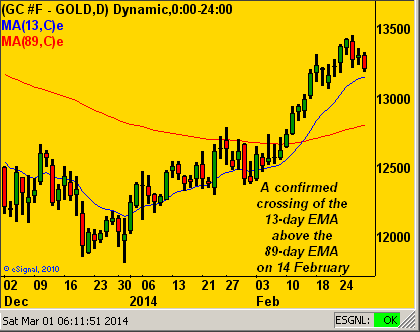
2) Two missives ago we pointed out the upside crossing of Gold's 13-day EMA (exponential moving average) above the 89-day EMA. For technically-based investors, this seemingly esoteric combination of EMAs does garner some visibility and as you website visitors know, 'tis one of the core measures used in our Market Rhythms analyses. The 13/89 combo signals have a tendency to endure for weeks without re-crossing and therein garner profitable follow-through by price. Indeed, this most recent crossing on 14 February is just the ninth one since 20 October 2011. The median follow-through of price after confirming a crossing? 66 points. And the minimum follow-through? 40 points in nine of the past ten crossings. That's a lot of points:
3) As fundamentals tend to "will out" in the long run, this may be the strongest case for Gold. Per the subject of last week's missive, the El Plungo in the Economic Barometer of late has been so stark, that the Fed may feel obliged to stop their tapering operations, perhaps as soon as the FOMC's mid-year (18 June) meeting. Regardless of the Econ Baro's late-week upward hitch, here's the current stance, (or lack thereof):
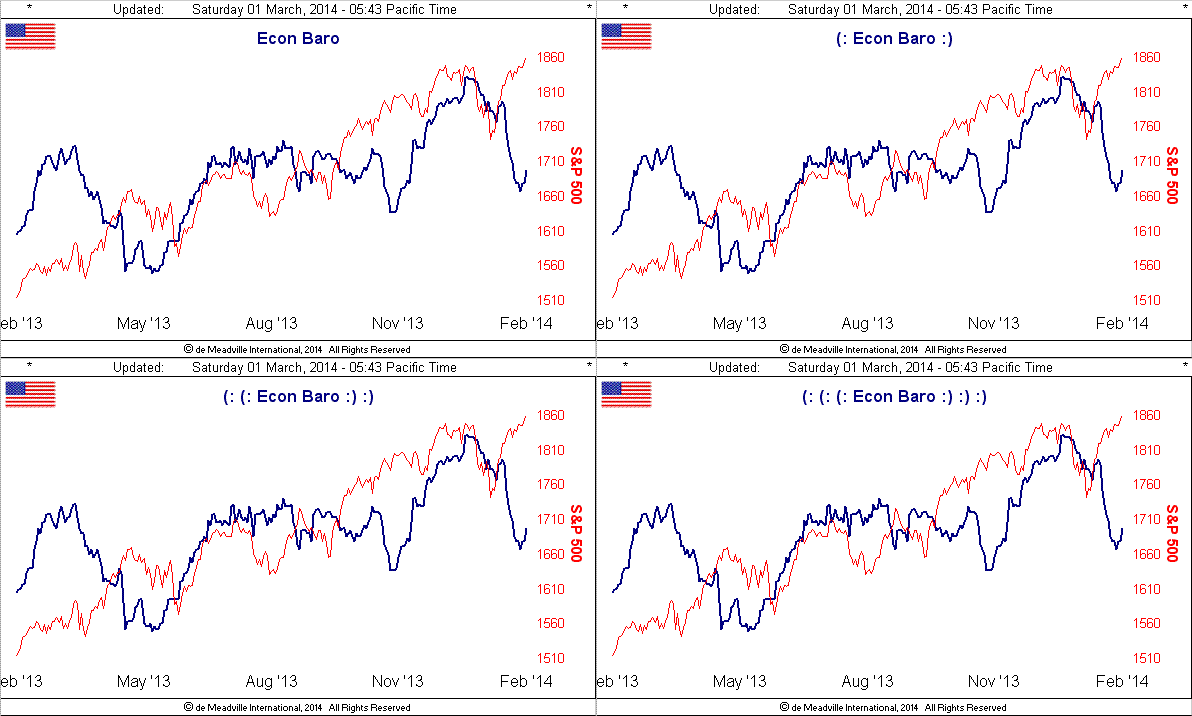
The above depiction of complacency (S&P) versus reality (Baro) puts me in mind of "The Eiger Sanction" (Universal, '75) where upon that iconic mountain's north face at the film's dénouement, Reiner Schöne in the role of one of the four climbers suddenly cries in horror "The ice is cracking!" Game over, (except for Clint, of course). And financially, 'tis Better to have a bar of Gold than one of Ice. (Plus as we've said in the past with regard to the Fed, they're stuck and they know it). "More dough please."
Speaking of dough, let's turn for a moment to the Dollar, the Index for which slumped sub-80 yesterday as concerns abated over EuroZone deflation. But from our technical analysis viewpoint, there's already been more to the story. Similar to Gold's positive EMA crossing discussed above, the Dollar Index based on weekly closes had its 13-week EMA confirm a cross below the 89-week EMA back on 28 October, after which there's thus far been very little if any downside by price ... albeit yesterday it spilled lower to settle at 79.815. To be sure, we've demonstrated on occasion that the correlation between Gold and the Dollar Index (as opposed to M2 money supplies), is hardly in perfect inverse. But consider this: these weekly EMA crossings come only rarely, this latest one being just the seventh since 2005. Thus here's the point: six of the last seven crossings have seen the Dollar Index then follow-through by at least four full points; that is a material amount for the Index to move. The confirmation of this current downside crossing came at the Index level of 79.300. Subtracting four full points from that gives us 75.300. The imperfect correlation to the contrary, what was the price of Gold the last time the Dollar Index was at 75.300?
"1746 on Halloween in 2011 mmb!"
Exactly right my friend. (We may offer Squire an analytical role in a future Gold Update ... stay tuned!)
As for the flow of dough into Gold, 'tis rightly been finding its way into the miners as they continue to gain ground on the metal itself. So with March dawning, we once again go year-over-year with Gold versus the HUI (Gold Bugs Index), XAU (Philly Exchange Precious Metals Index), GDX (miners exchange-traded fund) and the royalty company RGLD (Royal Gold). And oh my word...
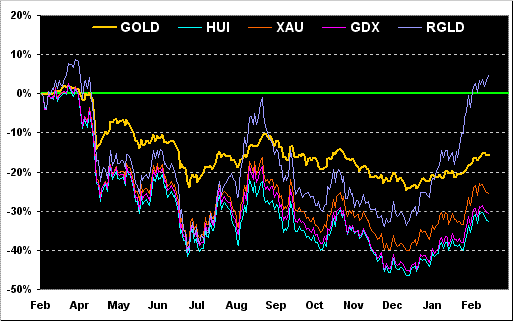
...the latter has actually moved into positive territory! Icing on the cake that.
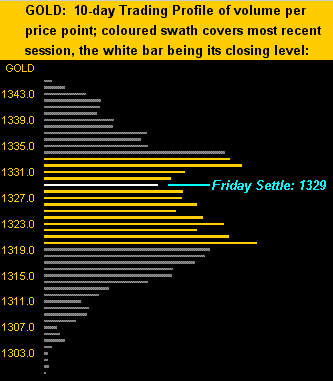
Regardless of one's participative role in Gold, whether via futures, bullion, coins, ETFs or equities, we can state the following broad perspective: after price "getting ahead of itself" in 2011 and then gathering and consolidating itself through 2012, 'twas next under the guise of false fundamentals pounded down terribly through 2013, to now having taken on a more rational technical grip, which in turn we believe will return price to and beyond its All-Time High (1923) on the foundation of true fundamentals. Still, with the prognosis for near-term weakness, let's go to Gold's Market Profile. The underlying support apex is at 1320, however should that go, we've seen in recent prior profiles further apex supports at both 1290 and 1275:
Finally, it seems hardly a week goes by without further fallout via the FinMedia for one major bank or another. How 'bout this one as regards the HilariouS Banking Corp. To wit: "HSBC seeks approval to lift bonus cap [admitting its] missing targets for cost efficiency and return on equity." Really? Then we've "JPMorgan Chase plans to eliminate 8,000 jobs this year." That's cute. And lastly, "Credit Suisse Says Executives Were Unaware of US Tax Evasion." Earlier we had the icing on the cake, but that last one takes it.
With Q4 Earnings Season now officially behind us, (58% of some 2000+ companies bettered their bottom lines and thus not the other 42%), we roll into a week rife with incoming data for the Econ Baro including the StateSide jobs numbers ... and then there's Crimea. Criminy!