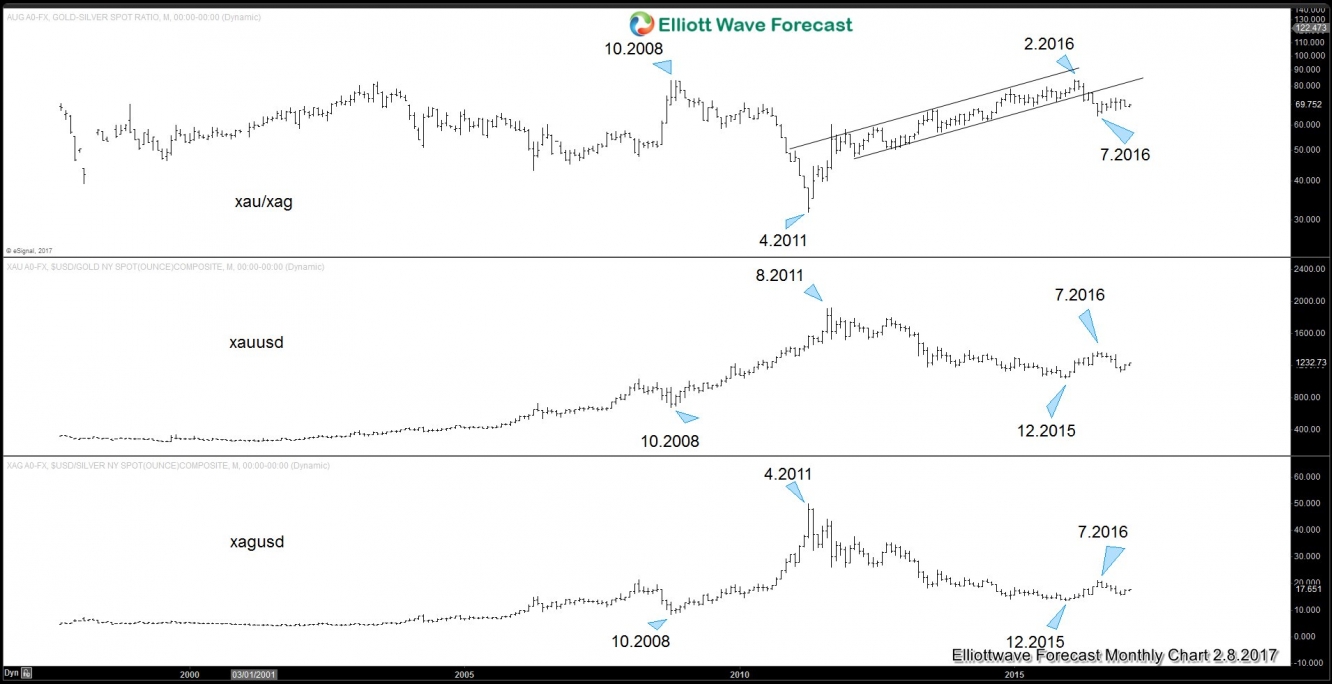
Gold-to-silver ratio inverse correlation with gold and silver
An overlay of the ratio XAU/XAG gold (XAU/USD), and silver (XAG/USD) above shows an inverse correlation. When the ratio is going lower, both metals are going higher. Conversely, when the ratio is going higher, both metals are going lower.
There’s a case to believe that the next direction of the ratio is lower due to:
1. The ratio made a triple top around 82
2. The ratio broke the bullish channel in 2016 and since bottoming in July 2016 created what looks like a bear flag
3. Current ratio (69) is too high compared to the historical ratio (around 40) and the natural ratio (around 15)
This suggests that when the ratio finally breaks lower, both metals are likely going to rally.
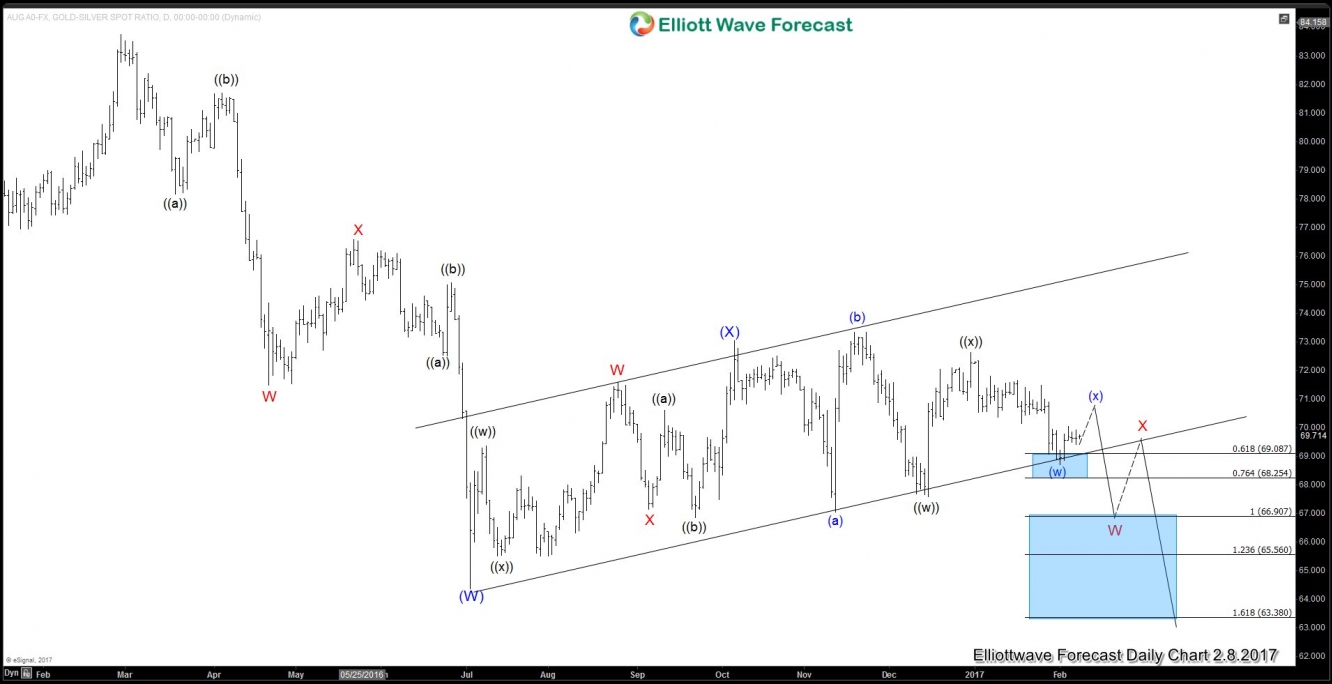
Gold-to-Silver Ratio Daily Chart
An analysis of the daily gold-to-silver ratio above suggests that after forming a top at 83.73 on 2/29/2016, the ratio turned lower in 7 swing, ending wave (W) at 64.37 on 7.4.2016. Since then, the ratio has been correcting the cycle from 2/29 high in a channel which looks like a bear flag.
There’s a possibility that wave (X) bounce is already completed at 73.03 although we need a break below (W) at 64.37 to add validity to this view. Until then, the ratio is still trading within the channel and can even rally back to the upper end of the channel. A break and close below the channel is an early indication that the ratio has started the next leg lower. When the ratio does finally resume lower, both metals should resume the rally higher.
