There is one thing that inarguably I've been right about this year. When the maniacal selling of Gold began in earnest, commensurate with the commencement of the baseball season last April, in the Gold missive dated 30 March 'twas written for: "...my Beloved Bronx Bombers to finish no better than in fourth place...". The New York Yankees concluded their 2013 season last Sunday in fourth place.
There are innumerable things that inarguably I've been wrong about this year. And second worst only to declaring the San Francisco Giants would return to the post-season to defend their 2012 World Series championship: 'tis been my striking out in championing Gold, let alone not having even had a base hit there all season.
A year ago we'd been looking for "twenty-five hundred by twenty-five December twenty-twelve". Now it seems like we're "fighting forever for fifteen hundred". A rough year to be sure in fashioning the course for Gold. A few days ago I actually blew the dust off my high school senior yearbook from better than 40 years ago. Therein the page for yours truly reads: "Ambition: Economist or Business Accountant; End Trend: A lonely street cleaner in front of the New York Stock Exchange."
How convenient that our local hardware store is already having its annual pre-Halloween broom sale. Those of you who've been scoring at home might recall in our Update written at the end of 2012 the notion of buying Gold right at the opening on New Year's Day. The price at that instant was 1676. Then in subsequent Updates we wrote of add-ons to that losing position. More recently we conceded, at least on the behalf of most futures traders, such a trading account by this point would have (to put it in NASCAR motor racing terminology) "done blowed up".
For the record, anyone surviving the course to this juncture, duly adding when noted and rolling over their contracts en route, would today be Long 7 units of Gold at an average price of 1457. Which come to think of it, at Gold's current level of 1311, means one's position is off a mere 10%.
In reality of course for a futures account, percentage gain or loss is not measured by the change in a market's price; 'tis rather measured by the change in leveraged value against the size of the account. So at $100 per contract per point: the current level of 1311 minus the break-even level of 1457 equals 146 points of loss, times $100/point equals $14,600 in turn times 7 contracts equals a marked-to-market loss right now of $102,200. We're that against a $1,000,000 trading account, the loss is 10%. But against the far more typically-sized $100,000 account: Bang! Game Over. Get out the broom.
Fortunately most folks with market exposure to Gold are not futures traders. Unfortunately if their Gold trading/investment vehicles of choice this year have been equities, neither, as with the case in futures, has it been pretty. The exception therein being the exchanged-traded fund (ETF) GLD as it essentially mirrors the price of Gold roughly divided by 10. Similarly in timing to that futures scaling-in strategy, add-ons to GLD would indeed have such position at this writing only off some 10% which, if held, mathematically shall lead to a handsome reward when Gold finally regains its upside momentum through the 1400s, 1500s and onward.
But lipstick on the pig or otherwise, as we've now passed from September into October, 'tis time once again for our year-over-year view of Gold itself, (the percentage track for GLD not displayed as 'twould show almost identically to that for Gold), along with the Gold Bugs Index (HUI), Philly Exchange Precious Metals Index (XAU), the ETF for the gold miners (GDX), and the royalty company Royal Gold (RGLD):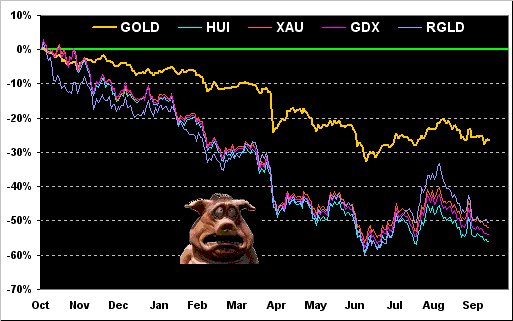
As said Sheriff J.W. Pepper to the Thai elephant in Eon Productions' 1974 Bond adventure ~The Man With The Gold Gun~: "Man... you is UGLY...". Indeed as measured from October a year ago, there was a point this past June wherein Gold's equities brethren were off by an almost whopping 60% per the above chart's low point. Of course -- and as is evident in the June-August period -- the Gold stocks crowd anticipates inevitable percentage upside growth on the order of two to even three times that of Gold itself.
Nevertheless, as we go to the weekly bars, Gold gave us another of its 1200s scare, only to recover and settle 'twixt resistance (1325) and support (1290-1287) near the week's mid-point at 1311. 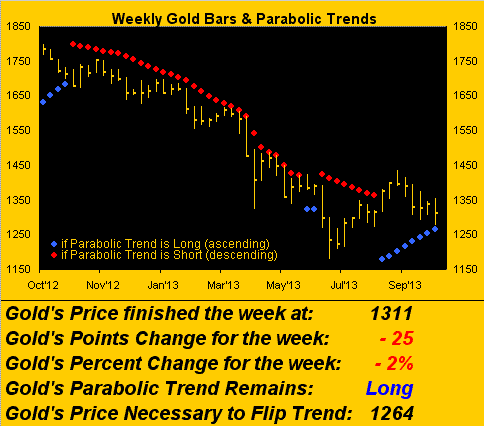
Note that the parabolic price to flip the trend from Long back to Short (per the rising blue dots) being at 1264 is below the aforementioned 1290-1287 support shelf which we readily next see here per the Market Profile of Gold's trading over the last 10 sessions: 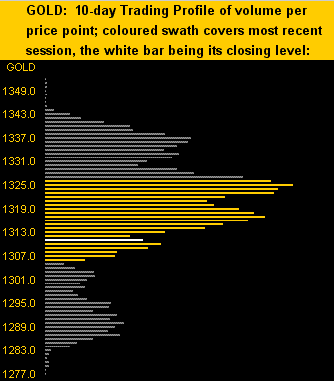
As the Golden Swath therein accounts for yesterday's (Friday's) trading range, note how price stalled right at the most extreme apex of resistance (1325) before settling at the white bar's level (1311). Having put forth the notion back in July that Gold was done with the 1200s for good, 'tis annoying to see price still flirting about that zone's upper reaches, especially in light of the Fed's having yet to reduce its pace of monetary debasement, which if it ever so does, shall nonetheless remain monetary debasement.
Even more than just annoying these days is not that so many correlative market metrics are simply out of sync, but moreover are out of sorts, a point upon which we've been relentlessly pounding of late. From the markets' media to its mavens, it seems indeed like they're out of mind: painting it with a broad brush, everybody is complacently going right along with what everybody else says or does. There's no questioning of anything for 'tis all accepted as normal truth. Logic is for chumps.
Well, this chump is putting forth the following question: "What's wrong with this picture?" 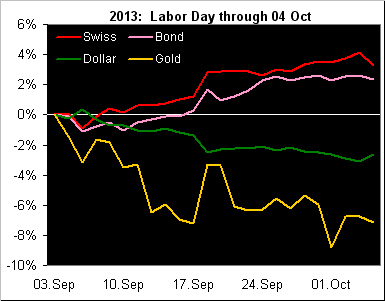
Look above at who's re-appearing in the starring role of "Safe Haven": albeit still softly-pegged to the Euro, the Swiss Franc since our Stateside Labor Day, through the Fed and ECB "do nothing" meetings and US government closure to today, has gained practically 4% against the Dollar, which in turn by its six currencies' basket Index is off -2%. Clearly the anticipated demise of the Bond market has been curtailed: 'tis gained 2%. Thus for the period, we've the Swiss Franc up, the Bond up, the Dollar down, and Gold down? By 7%?? With football season now well under way, 'tis absolutely appropriate to therefore yet again bring up that ever-infamous quote from the immortal Green Bay Packers head coach Vince Lombardi:
I'll tell ya what's goin' on and 'tis a bit scary: it takes comparatively little moneyflow these days to move the S&P 500 Index a distance of one point. As the following chart shows, back at the sub-700 March lows of 2009, it took upwards of $800,000 to $1,000,000 in a total Index trade to move it one point. Today it only takes just over $200,000: 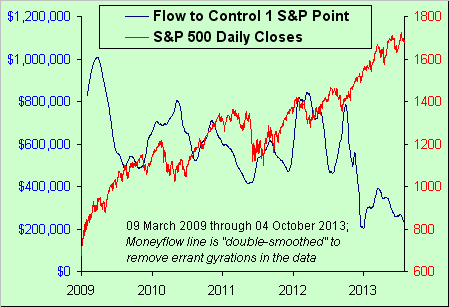
"But, mmb, a one-point move today is not the percentage distance it was back then..."
True enough, Squire, but here's the point: when a material correction finally hits the S&P, the amount of increased dough that shall flow through the system as the fear factor takes hold ought bode for a percentage drop far beyond the expectations of the Complacency Crowd to whom we just alluded. Fundamentals may be for fuddie-duddies but I'm ever mindful of the fact expressed by long time analyst Michael Holland: at the end of the day, stocks are valued by earnings. And as we've oft quipped of late, ex-financials, where are they?
I recall the Black Monday crash of '87, the Friday the 13th crash of '89, the Asian Contagion crash of '97, the Russian Financial Crisis crash of '98, the Dot-Com crash of '00, the Black Swan crash of '08, and the Flash crash of '10. Seems we're due, don't you? The Look Ma No Earnings crash of '13? Write it down?
Elsewhere, we've recently pointed out Mario Draghi's hesitancies over the feeble signs of economic growth in Europe. What about in Asia? China's manufacturing growth is slowing more than expected, suggesting the gradual recovery in the world’s second largest economy is similarly fragile. Meanwhile in Japan, Honest Abe has ordered the nation's first increase in its sales tax since 1997. Always a popular move, that. "Oh gee Mom, tempura at home again?"
So: StateSide we're contently lolling about in our massive asset and debt bubble; the EuroZone on the heels of austerity is clinging to what is, at best, fragmented growth; Asia's power plant is being drained of puff; ... what's left? What is the mitigating safe haven in which to be positioned ahead of any impending fallout? (Gadzooks, this is starting to sound like one of those commercials out there for Gold).
How fitting therefore to wrap it up for this week with the following animated graphic of Gold's 21-day linear regression trend, which remains down, its consistency therein denoted by the baby blue dots. The chart "moves" day-by-day from its stance one week ago through yesterday. Two observations therein: 1) price's springing back up from its mid-week excursion into the upper 1200s; and 2) the downtrending regression line becoming less steep as the Baby Blues continue to rise: 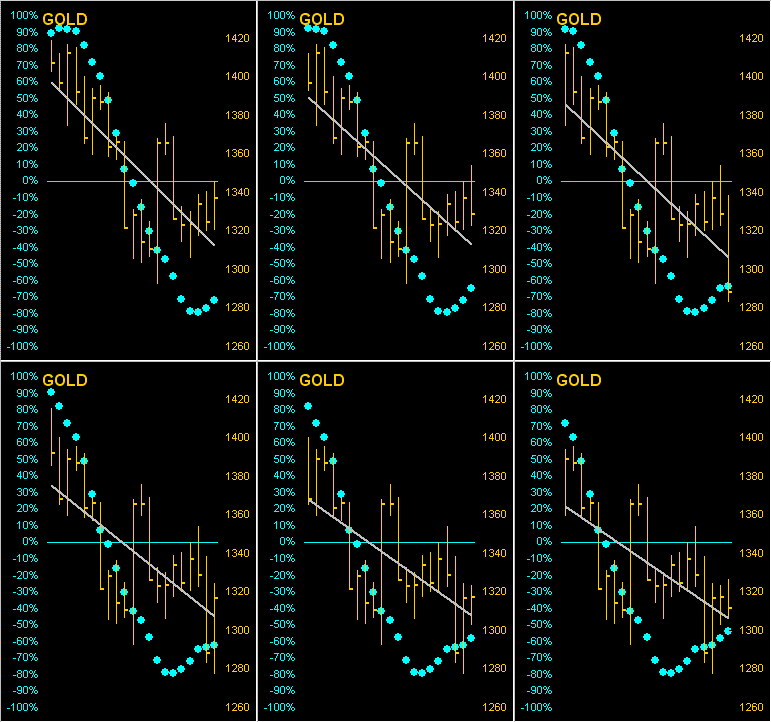
As noted a week ago, and now especially should the support shelf hold (1290-1287) per the Market Profile chart shown earlier, we could well look back to this time as a major turning up point for Gold. After all, 'twill have to have started from somewhere.
Finally, a watchword for sudden market volatility. Given the US government shutdown, we're lacking incoming data to this point on construction spending, factory orders and payrolls, (as itemized on our Economic Barometer). When such reports are in due course released, especially if so done without warning, the markets ought well go nuts. Mavens and Fuddie-Duddies, Chumps and Nuts; and they're all movin' the markets.
- English (UK)
- English (India)
- English (Canada)
- English (Australia)
- English (South Africa)
- English (Philippines)
- English (Nigeria)
- Deutsch
- Español (España)
- Español (México)
- Français
- Italiano
- Nederlands
- Português (Portugal)
- Polski
- Português (Brasil)
- Русский
- Türkçe
- العربية
- Ελληνικά
- Svenska
- Suomi
- עברית
- 日本語
- 한국어
- 简体中文
- 繁體中文
- Bahasa Indonesia
- Bahasa Melayu
- ไทย
- Tiếng Việt
- हिंदी
Is Gold At A Major Turning Point?
Latest comments
Loading next article…
Install Our App
Risk Disclosure: Trading in financial instruments and/or cryptocurrencies involves high risks including the risk of losing some, or all, of your investment amount, and may not be suitable for all investors. Prices of cryptocurrencies are extremely volatile and may be affected by external factors such as financial, regulatory or political events. Trading on margin increases the financial risks.
Before deciding to trade in financial instrument or cryptocurrencies you should be fully informed of the risks and costs associated with trading the financial markets, carefully consider your investment objectives, level of experience, and risk appetite, and seek professional advice where needed.
Fusion Media would like to remind you that the data contained in this website is not necessarily real-time nor accurate. The data and prices on the website are not necessarily provided by any market or exchange, but may be provided by market makers, and so prices may not be accurate and may differ from the actual price at any given market, meaning prices are indicative and not appropriate for trading purposes. Fusion Media and any provider of the data contained in this website will not accept liability for any loss or damage as a result of your trading, or your reliance on the information contained within this website.
It is prohibited to use, store, reproduce, display, modify, transmit or distribute the data contained in this website without the explicit prior written permission of Fusion Media and/or the data provider. All intellectual property rights are reserved by the providers and/or the exchange providing the data contained in this website.
Fusion Media may be compensated by the advertisers that appear on the website, based on your interaction with the advertisements or advertisers.
© 2007-2025 - Fusion Media Limited. All Rights Reserved.