Hourly Chart XAU/USD Hourly" title="XAU/USD Hourly" height="631" width="989">
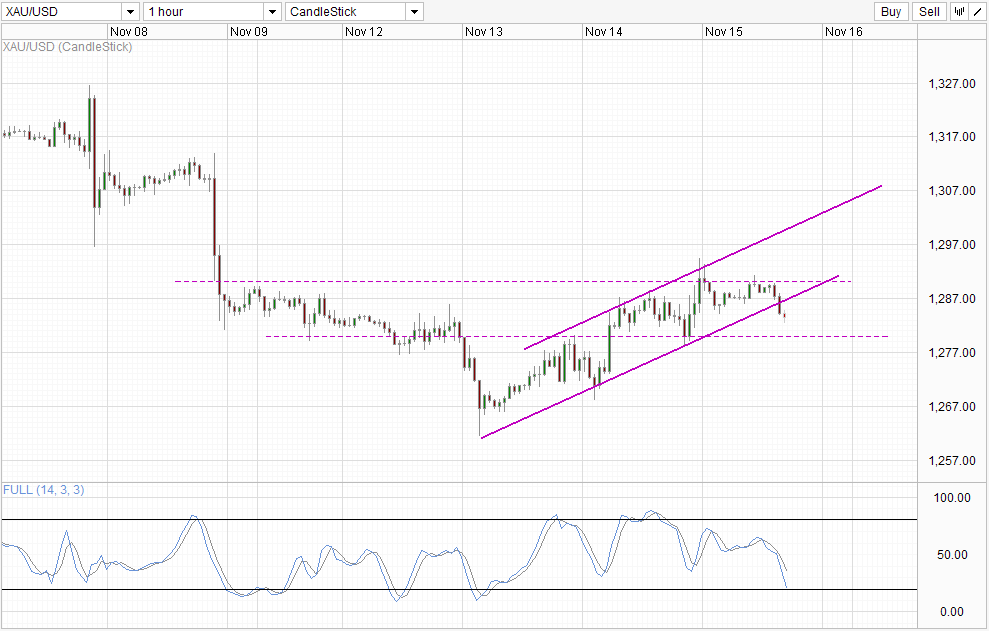
Despite all the hoo-hah following Janet Yellen's comments, Gold prices remain broadly bearish. Prices did rally higher on speculation that a December Taper event will not happen, but we were still unable to make any significant bullish headway. When we consider that market may be unreasonably bullish (borderline irrational) in their interpretation of what Yellen said, the failure of Gold to make any major advancement implies that underlying sentiment is heavily bearish. Case in point, prices have pulled back rather significantly since the peak formed during yesterday's US session. Prices have now broken the Channel Bottom - a representation of the bullish response brought by the speculative play - which opens up 1,280 support as the next target.
What happens at 1,280 will be the watershed moment for S/T Gold direction. Should prices break 1,280 by the end of today and a bearish acceleration happened early Monday morning, next week may be a bearish week for price to test 1,260 and potentially beyond. However, should 1,280 holds, a retest of 1,290 may be possible and the bearish momentum may be delayed.
Weekly Chart XAU/USD Weekly" title="XAU/USD Weekly" height="631" width="989">
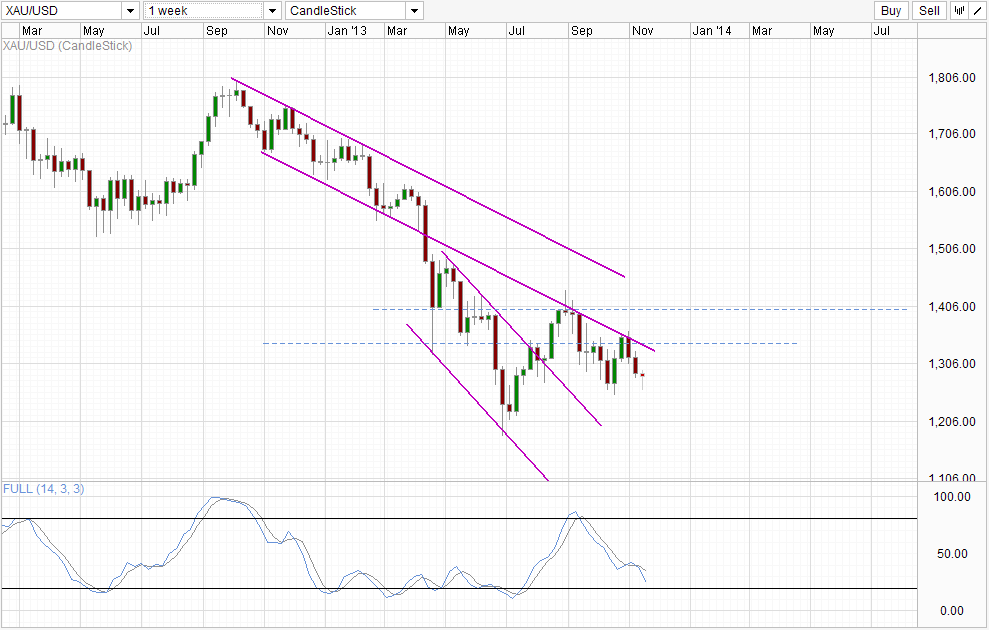
Weekly Chart remains bearish, but conviction has weakened significantly as we are no longer trading below the soft support of 1.272. Should price close around this level today, we will be having a long legged doji, which may be the primer for a bullish reversal "morning star" pattern. There is nothing that suggest that bullish momentum is in play right now, but traders should certainly be aware that such a possibility exist, especially since Stochastic readings are close to the Oversold level amidst a "support band" between 15.0 - 30.0 seen between Jan - June 2013. Hence do not be surprised if Stoch curve manage to reverse from here without warning.
Original post
- English (UK)
- English (India)
- English (Canada)
- English (Australia)
- English (South Africa)
- English (Philippines)
- English (Nigeria)
- Deutsch
- Español (España)
- Español (México)
- Français
- Italiano
- Nederlands
- Português (Portugal)
- Polski
- Português (Brasil)
- Русский
- Türkçe
- العربية
- Ελληνικά
- Svenska
- Suomi
- עברית
- 日本語
- 한국어
- 简体中文
- 繁體中文
- Bahasa Indonesia
- Bahasa Melayu
- ไทย
- Tiếng Việt
- हिंदी
Gold: Staying Bearish Under 1,290
Published 11/15/2013, 02:04 PM
Updated 07/09/2023, 06:31 AM
Gold: Staying Bearish Under 1,290
Latest comments
Loading next article…
Install Our App
Risk Disclosure: Trading in financial instruments and/or cryptocurrencies involves high risks including the risk of losing some, or all, of your investment amount, and may not be suitable for all investors. Prices of cryptocurrencies are extremely volatile and may be affected by external factors such as financial, regulatory or political events. Trading on margin increases the financial risks.
Before deciding to trade in financial instrument or cryptocurrencies you should be fully informed of the risks and costs associated with trading the financial markets, carefully consider your investment objectives, level of experience, and risk appetite, and seek professional advice where needed.
Fusion Media would like to remind you that the data contained in this website is not necessarily real-time nor accurate. The data and prices on the website are not necessarily provided by any market or exchange, but may be provided by market makers, and so prices may not be accurate and may differ from the actual price at any given market, meaning prices are indicative and not appropriate for trading purposes. Fusion Media and any provider of the data contained in this website will not accept liability for any loss or damage as a result of your trading, or your reliance on the information contained within this website.
It is prohibited to use, store, reproduce, display, modify, transmit or distribute the data contained in this website without the explicit prior written permission of Fusion Media and/or the data provider. All intellectual property rights are reserved by the providers and/or the exchange providing the data contained in this website.
Fusion Media may be compensated by the advertisers that appear on the website, based on your interaction with the advertisements or advertisers.
© 2007-2024 - Fusion Media Limited. All Rights Reserved.