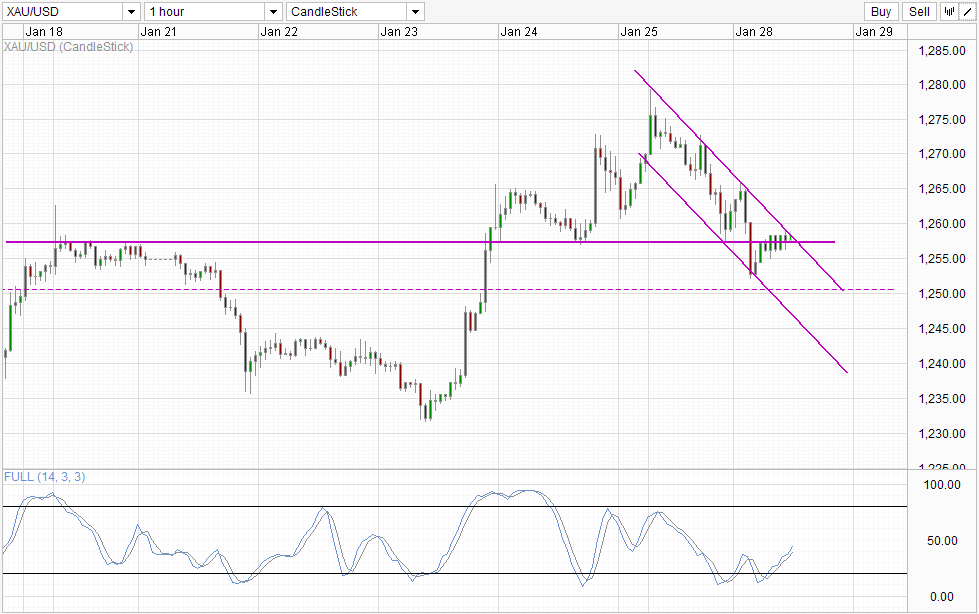
Gold climb down rather aggressively yesterday, shedding around 25 dollars an ounce from peak to trough. This cannot be regarded as a huge surprise as our analysis yesterday has already pointed out that bears continue to lurk and will likely pounce since the reason for the bullish push on Thursday and Friday were weak at best and illogical at worst.
Hourly Chart

Nonetheless, it is interesting to see that the sell-off is so aggressive, breaking the 1,257 support easily at the 2nd time of asking. Perhaps Gold bears smelled blood given that broad risk appetite wasn't as weak as before if we look at price action of S&P 500 - one of the better if not best proxy for risk appetite. The small bullish push during early US session coincided with the release of weaker than expect New Home Sales numbers, lending credence to this assertion. What this suggest is that we should not be seeing strong bearish sell-off in the immediate future as broad risk sentiment is still bearish - which will provide bullish support against any strong bearish momentum.
From a technical perspective, it is possible that there were added bearish pressure as price broke away from the rising Channel (not marked out on chart) that was in play on Friday. With this break a new descending Channel has since formed, with prices currently testing the confluence between descending Channel Top and 1,257. Even though Stochastic readings are currently pointing up, it will not be surprising to see the Stoch curve reversing as we approach the "resistance" level of 40.0. Hence, there is no immediate threat to the bearish momentum, and a push Channel Bottom remains on track with 1,250 expected provide strong bullish support.
Daily Chart

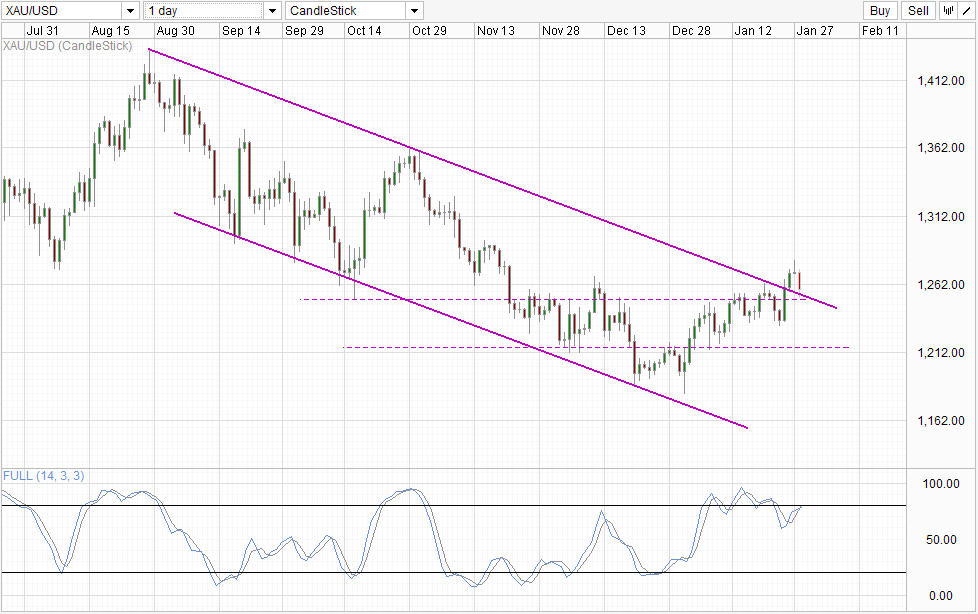
An Evening Star pattern good to go, and this is a decent bearish pattern considering that current price is just a hair lower than the opening price of the candle left to the Doji. Stochastic readings is also bearish with Stoch/Signal lines crossing just under the Overbought region. However, price will need to break back into the Channel and preferably below 1,250 before strong bearish conviction can be confirmed. If this break coincide with Stoch levels below recent low of 60.0, the strength of the bearish signal becomes higher and we could see prices heading towards Channel Bottom with 1,230+ and 1,215 and 1,200 providing support.
The only problem with this outlook is that broad risk trends is still bearish, and there is the risk of a major sell off given that current stock positions are at the most leveraged levels on record. Hence, there is upside risk for Gold even though QE taper has reduced inflation risk. Also, given the long-term upside risk, it is unlikely that institutional investors/speculators will want to clear their long positions as they will want to use Gold has a hedge against sudden dips. As such, the likelihood of strong dips in Gold moving forward decreases, and we could only see slow declines moving forward even though fundamentals do agree that Gold prices remain on the high side.
