Gold prices pushed higher on open this morning, continuing the bullish trend that was seen during US session last Friday. Prices were lifted by weaker than expected Housing Starts and U. of Michigan Confidence which drove stock prices lower and safe havens higher. This "risk off" sentiment flowed into Asian markets this morning, with Asian stocks opening lower which propped Gold prices higher.
It is likely that Commitment of Traders data compiled by the CFTC helped asserted further bullish pressure. The latest numbers reflected yet another increase in Net Long position by institutional speculators. Prices of 14th Jan (which this COT number is based on) is about $10 an ounce higher than the prior Tuesday (7th Jan), so it is no surprise that Net Long position should increase. The question that remains though, is whether the increment of net long positions by more than 5,000 contracts warranted since prices have actually tapered lower from the swing high of 1,255 not too long ago - suggesting that the bullish push from 1,218 on 9th Jan was coming to an end. Furthermore, the last week's Net Long grew by 6,000+ contracts, but prices have actually gained almost $30 an ounce W/W. This discrepancy in ratio suggest that there are much more number of bullish traders behind current move, which implies that the rally from 9th Jan is far from over. Open Interest volume has also gained considerably, currently standing above 415,000 contracts, showing that current bullish run is supported by proper volume as well.
Hourly Chart XAU/USD Hourly" title="XAU/USD Hourly" height="616" width="979">
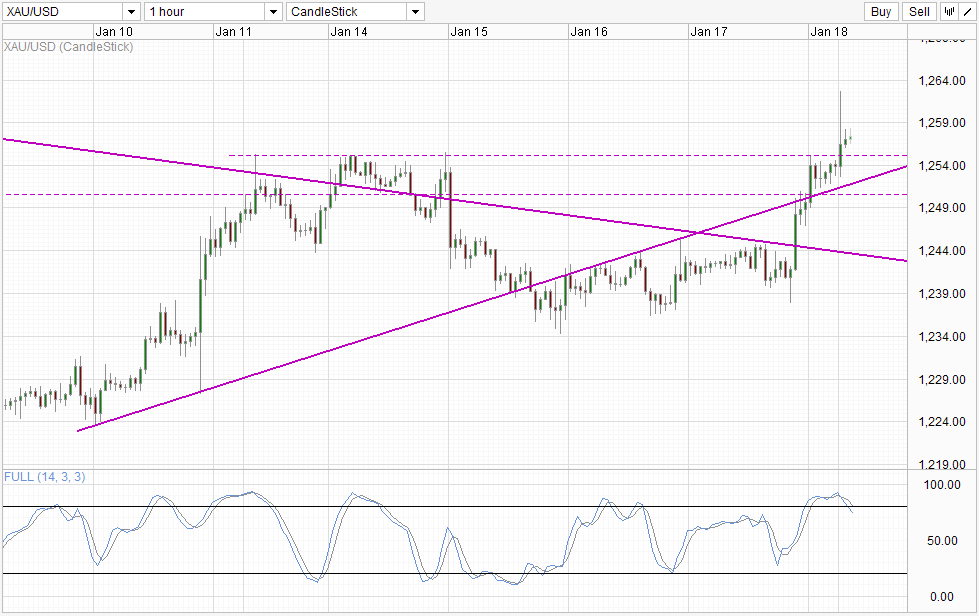
Given all these, it becomes more understandable why prices managed to clear the 1,255 resistance this morning. Prices have pulled back a huge portion of the initial gains, but we're still above the 1,255 resistance. Even the better than expected Chinese GDP which allowed Asian stocks to recover has failed to allow Gold to test 1,255 once more, highlighting current bullish strength.
From a pure technical basis though, a break of 1,255 cannot be ruled out yet as Stochastic readings have just given us a bearish cycle signal. However, it is possible that prices may find support from the rising trendline of 1,250 round figure support should that happens. This is in line with Stochastic curve as readings are may find "support" around the 70.0 level looking at historical levels of Stoch curve in the past 2 weeks. Hence, it is likely that bullish pressure will remain intact in the Short term.
Daily Chart XAU/USD Daily" title="XAU/USD Daily" height="614" width="978">
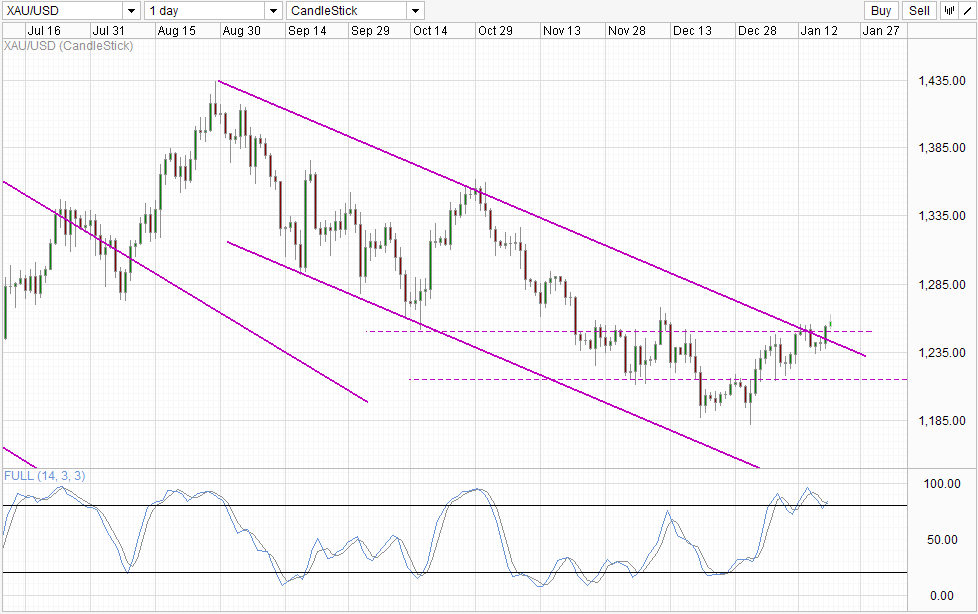
Sentiments may also be shifting in the long-term. Prices have broken away from the descending Channel Top, and Stochastic readings have invalidated the bearish cycle signal that was in play just last week. Should prices break the previous swing high of 1,267, we could see stronger bullish conviction that may be able to bring us all the way up towards 1,300 with 1,290 providing resistance.
However, fundamentally this rally is interesting as there is nothing that could be driving Gold prices higher in the long run. QE will eventually end, while the narrative for global recovery story remains in play. Hence there will be limited inflation risks and risk aversion flows that can propel Gold higher. Current rally appears to be driven by institutional speculators, a behaviour that we've seen back in April 2013 and once more in July 2013. Both attempts failed to keep Gold appreciated in the long run. Perhaps 3rd time is the charm, but there is very little to justify the optimism of these speculators right now, and it is likely that long-term fundamentals will weigh Gold prices down eventually when these speculators are no longer able to buy.
Original post
- English (UK)
- English (India)
- English (Canada)
- English (Australia)
- English (South Africa)
- English (Philippines)
- English (Nigeria)
- Deutsch
- Español (España)
- Español (México)
- Français
- Italiano
- Nederlands
- Português (Portugal)
- Polski
- Português (Brasil)
- Русский
- Türkçe
- العربية
- Ελληνικά
- Svenska
- Suomi
- עברית
- 日本語
- 한국어
- 简体中文
- 繁體中文
- Bahasa Indonesia
- Bahasa Melayu
- ไทย
- Tiếng Việt
- हिंदी
Gold: Pushing Above 1,255 On Speculators, Risk Aversion Flow
ByMarketPulse
AuthorMingze Wu
Published 01/20/2014, 12:31 AM
Gold: Pushing Above 1,255 On Speculators, Risk Aversion Flow
Latest comments
Loading next article…
Install Our App
Risk Disclosure: Trading in financial instruments and/or cryptocurrencies involves high risks including the risk of losing some, or all, of your investment amount, and may not be suitable for all investors. Prices of cryptocurrencies are extremely volatile and may be affected by external factors such as financial, regulatory or political events. Trading on margin increases the financial risks.
Before deciding to trade in financial instrument or cryptocurrencies you should be fully informed of the risks and costs associated with trading the financial markets, carefully consider your investment objectives, level of experience, and risk appetite, and seek professional advice where needed.
Fusion Media would like to remind you that the data contained in this website is not necessarily real-time nor accurate. The data and prices on the website are not necessarily provided by any market or exchange, but may be provided by market makers, and so prices may not be accurate and may differ from the actual price at any given market, meaning prices are indicative and not appropriate for trading purposes. Fusion Media and any provider of the data contained in this website will not accept liability for any loss or damage as a result of your trading, or your reliance on the information contained within this website.
It is prohibited to use, store, reproduce, display, modify, transmit or distribute the data contained in this website without the explicit prior written permission of Fusion Media and/or the data provider. All intellectual property rights are reserved by the providers and/or the exchange providing the data contained in this website.
Fusion Media may be compensated by the advertisers that appear on the website, based on your interaction with the advertisements or advertisers.
© 2007-2025 - Fusion Media Limited. All Rights Reserved.
