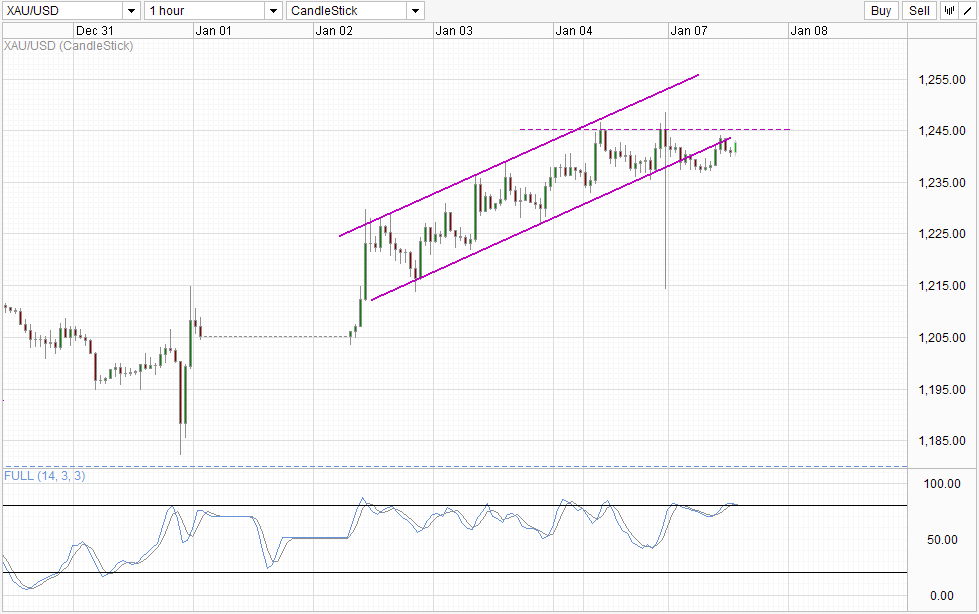
Gold prices have stabilized after the flash sell-off during US session where a singular trade of 4,200 contracts was made, sending gold tumbling lower by $30 per ounce which triggered a 10 second trading halt. Prices recovered quickly within the same minute, but the bearish damage has been done with market getting jittery and pushing lower in the next half a dozen hours that followed.
Hourly Chart XAU/USD Hourly" title="XAU/USD Hourly" height="614" width="451">
This subsequent decline broke the rising Channel that has been in play since the start of 2014 and suggest that bullish momentum may be reversing. Prices did recover for a 2nd time but this bullish push has been rebuffed by Channel Bottom, affirming the bearish bias. Currently we are on our way to test the Channel Bottom once again but the likelihood of it succeeding is low especially since bulls will be squaring off with the 1,245 resistance level on top of Channel Bottom this time round. Stochastic indicator also favor a bearish push Stoch curve appearing "toppish" and seems likely to push below the 80.0 level and trigger a bearish cycle signal. 1,235 is the first obvious S/T bearish target but prices can realistically go all the way to the opening levels of 2014 should if the bullish pressure is indeed invalidated.
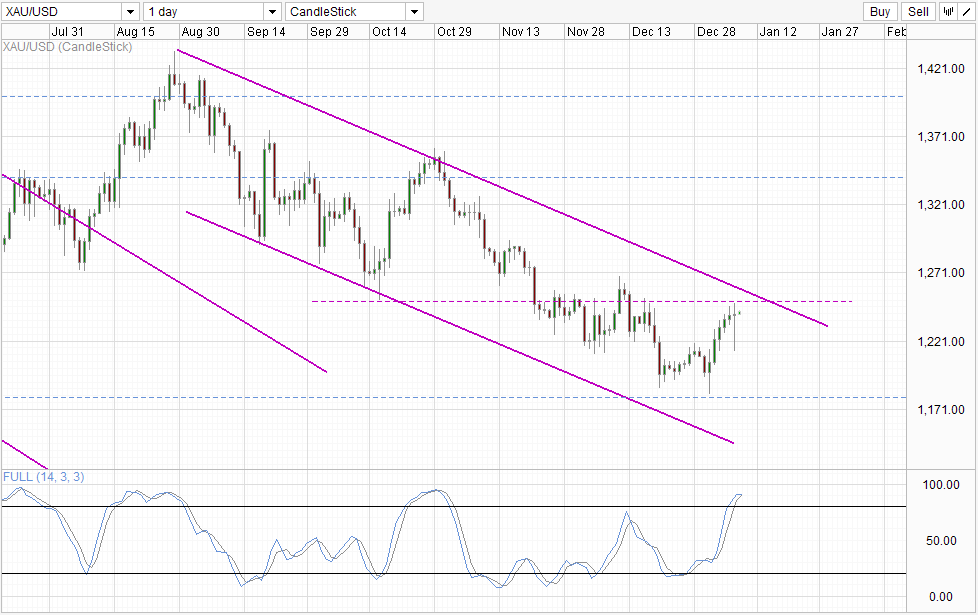
Daily Chart
Long-term chart continue to reflect bearishness, with the 1,245 rejection even more significant on the Daily Chart. Nonetheless, despite this bearishness we could still see prices potentially pushing up slightly higher just to test Channel Top before moving lower. Alternatively, price could still remain around current levels before finally tagging Channel Top next week before pushing lower once again. Stochastic readings similarly appear "toppish" just like those one the Hourly Chart, but we are still a distance before a bearish cycle signal is formed. Hence, do not assume that prices will automatically move lower from here as bullish scenario in the short-term is certainly possible.
Original post
- English (UK)
- English (India)
- English (Canada)
- English (Australia)
- English (South Africa)
- English (Philippines)
- English (Nigeria)
- Deutsch
- Español (España)
- Español (México)
- Français
- Italiano
- Nederlands
- Português (Portugal)
- Polski
- Português (Brasil)
- Русский
- Türkçe
- العربية
- Ελληνικά
- Svenska
- Suomi
- עברית
- 日本語
- 한국어
- 简体中文
- 繁體中文
- Bahasa Indonesia
- Bahasa Melayu
- ไทย
- Tiếng Việt
- हिंदी
Gold: Mild Bearish Sentiment Seen After Sudden Plunge
ByMarketPulse
AuthorMingze Wu
Published 01/07/2014, 05:33 AM
Updated 03/05/2019, 07:15 AM
Gold: Mild Bearish Sentiment Seen After Sudden Plunge
Latest comments
Loading next article…
Install Our App
Risk Disclosure: Trading in financial instruments and/or cryptocurrencies involves high risks including the risk of losing some, or all, of your investment amount, and may not be suitable for all investors. Prices of cryptocurrencies are extremely volatile and may be affected by external factors such as financial, regulatory or political events. Trading on margin increases the financial risks.
Before deciding to trade in financial instrument or cryptocurrencies you should be fully informed of the risks and costs associated with trading the financial markets, carefully consider your investment objectives, level of experience, and risk appetite, and seek professional advice where needed.
Fusion Media would like to remind you that the data contained in this website is not necessarily real-time nor accurate. The data and prices on the website are not necessarily provided by any market or exchange, but may be provided by market makers, and so prices may not be accurate and may differ from the actual price at any given market, meaning prices are indicative and not appropriate for trading purposes. Fusion Media and any provider of the data contained in this website will not accept liability for any loss or damage as a result of your trading, or your reliance on the information contained within this website.
It is prohibited to use, store, reproduce, display, modify, transmit or distribute the data contained in this website without the explicit prior written permission of Fusion Media and/or the data provider. All intellectual property rights are reserved by the providers and/or the exchange providing the data contained in this website.
Fusion Media may be compensated by the advertisers that appear on the website, based on your interaction with the advertisements or advertisers.
© 2007-2024 - Fusion Media Limited. All Rights Reserved.
