Hourly Chart
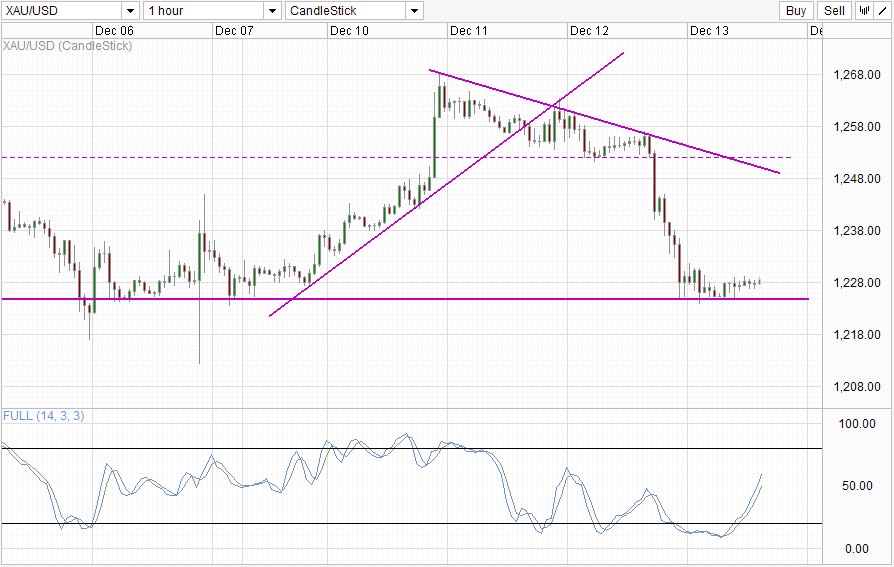
Gold prices fell sharply yesterday after we've just wrote the analysis which said that prices are "directionless" between 1,251.5 and 1,255. The reason for the sell-off? Break of 1,251.5 support. Decline in risk appetite contributed as well, but it should be noted that the largest 1 hour decline happened during early European hours before US market came into play and was the same hour when the aforementioned support level was broken. This bearishness cannot be regarded as unexpected, as prices were never truly bullish to begin with - recent bullish pushes have gone unexplained other than speculation that there are some big buyers lurking around. This is in no way representative of broad sentiment about Gold and gold prices were running the risk of a strong bearish correction.
Currently prices are staying above 1,225 support, which is also understandable as it is unlikely that bears will have the conviction to sell heavily given the unexpected nature of recent flash rallies. We have no idea when they will suddenly pop up and that will prevent bears from entering large punts especially given FOMC meeting next week. Hence, the likelihood of price breaking the support band from 1,212 - 1,225 today is low and we may actually still find some space for rebound towards 1,235+ levels.
Daily Chart
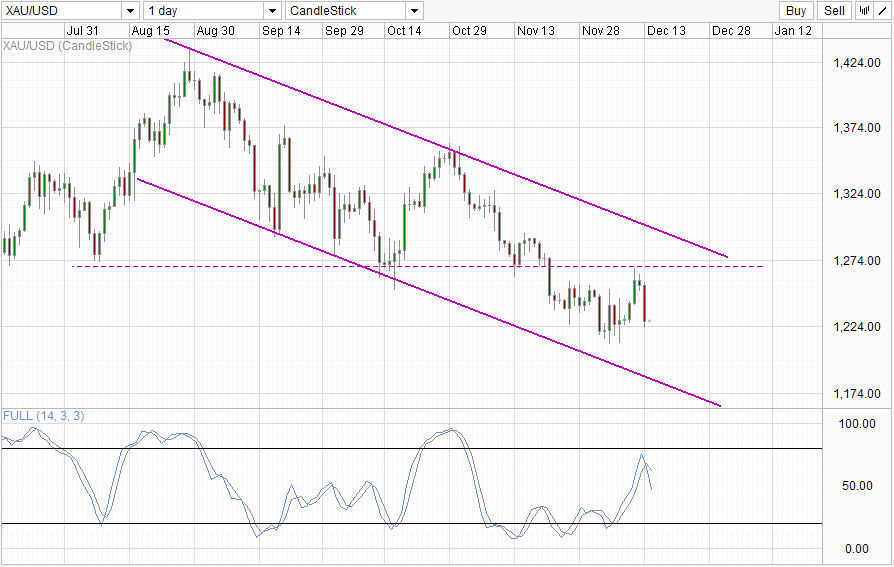
Daily Chart is undoubtedly bearish though with a new Stoch peak formed. This adds as confirmation for the rejection of 1,270 resistance and opens up Channel Bottom as the bearish target. We can also see the importance of 1,225 which is the swing low back on 26th Nov. Should price break 1,225 we could see bearish acceleration towards 1,212, following which will be the last interim support 1,200 and subsequently the ultimate Channel Bottom target.
Original post
- English (UK)
- English (India)
- English (Canada)
- English (Australia)
- English (South Africa)
- English (Philippines)
- English (Nigeria)
- Deutsch
- Español (España)
- Español (México)
- Français
- Italiano
- Nederlands
- Português (Portugal)
- Polski
- Português (Brasil)
- Русский
- Türkçe
- العربية
- Ελληνικά
- Svenska
- Suomi
- עברית
- 日本語
- 한국어
- 简体中文
- 繁體中文
- Bahasa Indonesia
- Bahasa Melayu
- ไทย
- Tiếng Việt
- हिंदी
Gold: Finding Support Above 1,225
Published 12/13/2013, 05:24 AM
Updated 07/09/2023, 06:31 AM
Gold: Finding Support Above 1,225
Latest comments
Loading next article…
Install Our App
Risk Disclosure: Trading in financial instruments and/or cryptocurrencies involves high risks including the risk of losing some, or all, of your investment amount, and may not be suitable for all investors. Prices of cryptocurrencies are extremely volatile and may be affected by external factors such as financial, regulatory or political events. Trading on margin increases the financial risks.
Before deciding to trade in financial instrument or cryptocurrencies you should be fully informed of the risks and costs associated with trading the financial markets, carefully consider your investment objectives, level of experience, and risk appetite, and seek professional advice where needed.
Fusion Media would like to remind you that the data contained in this website is not necessarily real-time nor accurate. The data and prices on the website are not necessarily provided by any market or exchange, but may be provided by market makers, and so prices may not be accurate and may differ from the actual price at any given market, meaning prices are indicative and not appropriate for trading purposes. Fusion Media and any provider of the data contained in this website will not accept liability for any loss or damage as a result of your trading, or your reliance on the information contained within this website.
It is prohibited to use, store, reproduce, display, modify, transmit or distribute the data contained in this website without the explicit prior written permission of Fusion Media and/or the data provider. All intellectual property rights are reserved by the providers and/or the exchange providing the data contained in this website.
Fusion Media may be compensated by the advertisers that appear on the website, based on your interaction with the advertisements or advertisers.
© 2007-2024 - Fusion Media Limited. All Rights Reserved.