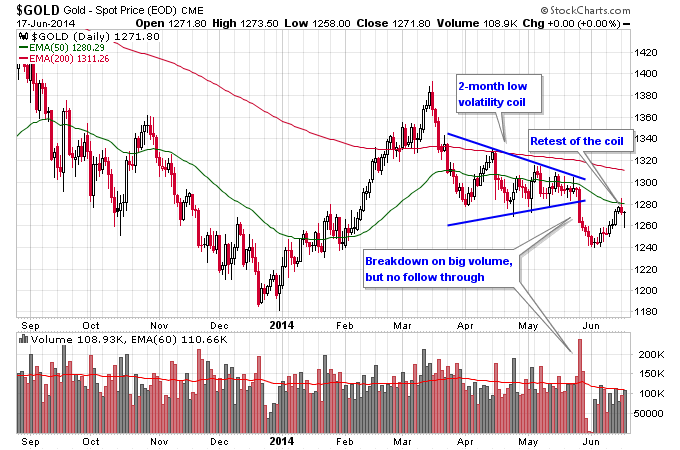
Gold has failed to break down significantly from the tight coil pattern it created over a 2-month period. Failed breakdowns often mark key reversal points in markets, especially after moves that take a while to play out. In a downtrend, the duration of the move produces the angst and disgust that causes most of the selling. Then the final break of support creates the final flush-out of the weak holders who didn't sell earlier in the move.
When there's not enough selling pressure to continue the breakdown, the market often reverses higher in a fast and powerful manner. The selling pressure isn't there anymore and new buyers push the market rapidly higher. The market basically gets caught looking in the rear view mirror, expecting more of the same thing to happen forever. Meanwhile, quickly and with force things change when many aren't paying attention and a new trend develops.
After the coil in gold broke down in late May, I noticed that sentiment on gold turned very bearish as if everyone was throwing in the towel. I even heard a podcast that I've never witnessed bearish on gold, say it wasn't a good time to buy gold. But as of yet, the breakdown out of this coil has not produced significant follow through selling. Check out the chart of gold below to see exactly how this has unfolded.
Clearly, $1280 is an important level going forward for gold since it represents resistance from the coil, and is also where the 50 day moving average sits currently. If gold can surprise the bears to the upside and complete the failed breakdown things could get interesting.
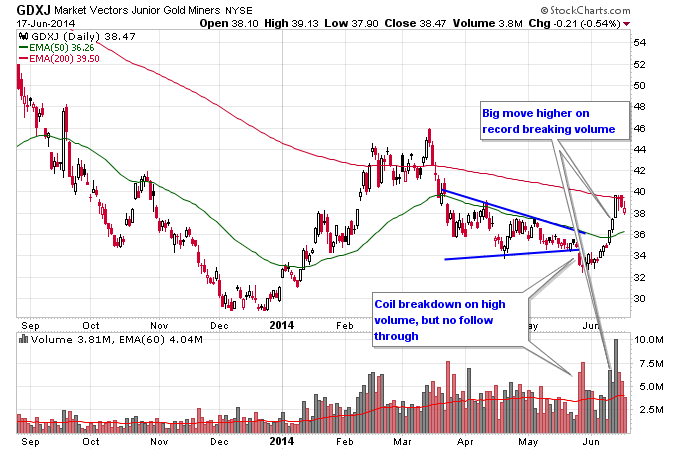
What's even more interesting than gold though is what has happened in the mining stocks. Market Vectors Gold Miners (ARCA:GDX) and Market Vectors Junior Gold Miners (ARCA:GDXJ) experienced only two-day breakdowns from their coils. These breakdowns occurred on high volume, but the buyers overwhelmed the sellers after merely two days.
Then, after drifting sideways for a few days both GDX and GDXJ blasted higher last week. GDXJ was able to get back above the 50 day moving average, above the top of the coil, and is now threatening the 200 day moving average. GDXJ also had record breaking volume in this latest move higher. This is starting to look like textbook failed move to fast move higher material, as just as quickly as the downtrend ended an explosive move higher is starting to develop.
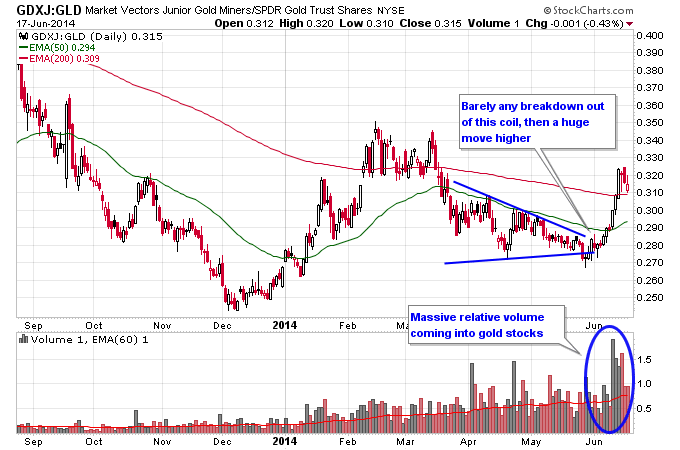
One last thing to note is what has occurred in the mining stocks, relative to gold. You would expect that if gold was to break down out of a tight consolidation, and the bears were to win, that gold stocks would get punished relative to gold since they tend to amplify moves in gold. But exactly the opposite happened on this latest coil breakdown in gold. Taking a look at GDXJ:GLD which compares GDXJ relative to SPDR Gold Trust (ARCA:GLD), we can see that immediately after the failed breakdown in gold, gold stocks showed superior relative strength. In fact not only did this ratio blast back higher but it got back above the 50 and 200 day moving averages in a hurry. And on massive relative volume.
In a healthy gold market you want to see gold stocks outperforming the metal, and this failed breakdown in gold at the end of May is starting to look like it is forming a launchpad for a continued move higher in gold and gold stocks.


