Hourly Chart XAU/USD Hourly" title="XAU/USD Hourly" height="568" width="894">
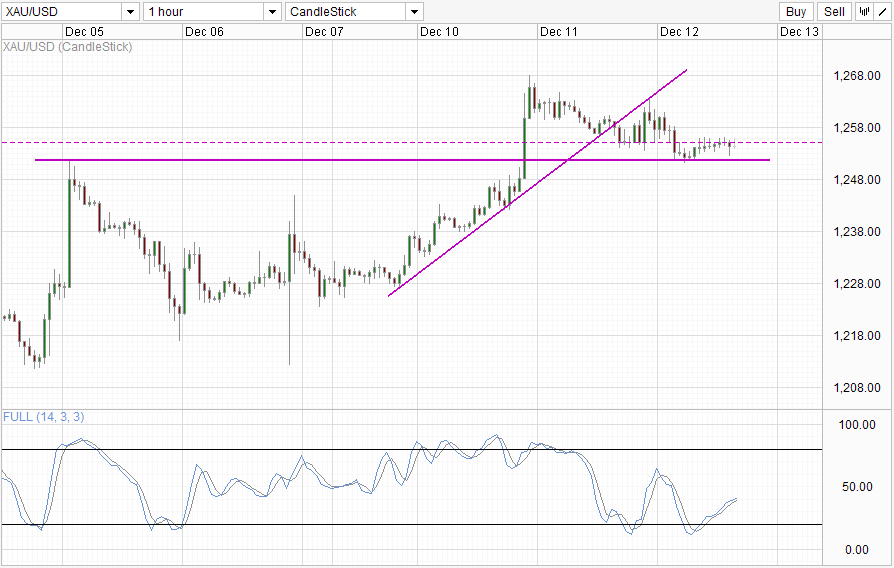
Not much movement seen in Gold following Tuesday's sharp rally. Prices have been slowly trickling lower as expected as the bullish move wasn't supported by fundamentals nor adequately explained by technicals. Currently price is below 1,255 - the resistance that was in play 2 weeks ago and 1,251.5 - the ceiling 2 weeks ago and the support just a few hours ago. Stochastic indicator favor a rebound from 1,251.5 with a bullish cycle currently in play, but the in ability to break 1,255 will continue to weigh and open up a retest of 1,251.5 and potentially a bearish breakout with 1,212 as ultimate bearish target. Traders should not be surprise at such a possibility as Stoch curve has yet to clear the "consolidation zone" between 42.0 - 64.0, where current bullish cycle could be cut short just like the one seen half a day ago.
Daily Chart XAU/USD Daily" title="XAU/USD Daily" height="568" width="894">
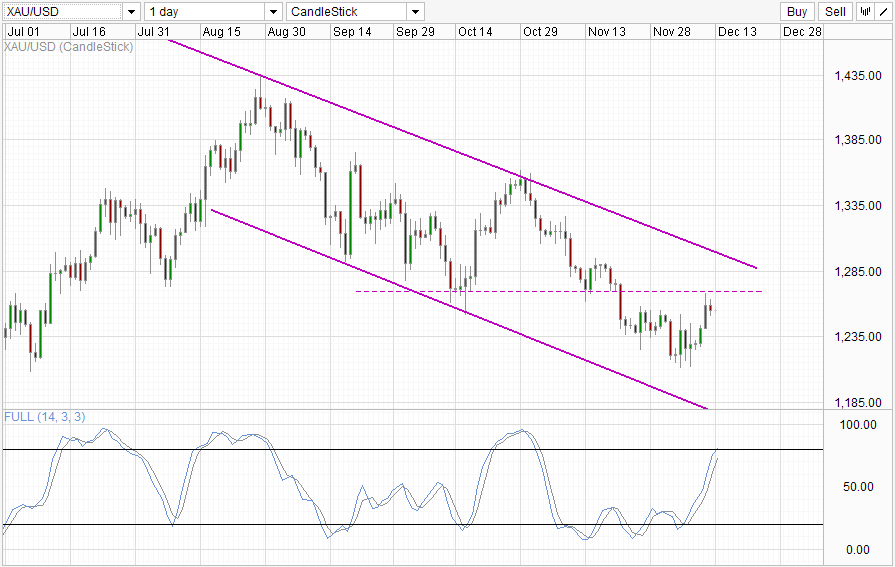
Daily Chart favors bearish scenarios moving forward as well as prices is pulling lower after hitting the 1,270 resistance. Stochastic indicator concurs with Stoch curve already entering the Overbought region. However, a bearish cycle is not yet indicated as Stoch curve is still pointing higher and above the 80.0 mark. Similarly, price will need to breach below 1,251 and preferably below 1,235 in order for stronger bearish conviction to emerge and Channel Bottom to become a viable bearish target.
Original post
- English (UK)
- English (India)
- English (Canada)
- English (Australia)
- English (South Africa)
- English (Philippines)
- English (Nigeria)
- Deutsch
- Español (España)
- Español (México)
- Français
- Italiano
- Nederlands
- Português (Portugal)
- Polski
- Português (Brasil)
- Русский
- Türkçe
- العربية
- Ελληνικά
- Svenska
- Suomi
- עברית
- 日本語
- 한국어
- 简体中文
- 繁體中文
- Bahasa Indonesia
- Bahasa Melayu
- ไทย
- Tiếng Việt
- हिंदी
Gold: Directionless Between 1,251.5 And 1,255
Published 12/12/2013, 05:02 AM
Updated 07/09/2023, 06:31 AM
Gold: Directionless Between 1,251.5 And 1,255
Latest comments
Loading next article…
Install Our App
Risk Disclosure: Trading in financial instruments and/or cryptocurrencies involves high risks including the risk of losing some, or all, of your investment amount, and may not be suitable for all investors. Prices of cryptocurrencies are extremely volatile and may be affected by external factors such as financial, regulatory or political events. Trading on margin increases the financial risks.
Before deciding to trade in financial instrument or cryptocurrencies you should be fully informed of the risks and costs associated with trading the financial markets, carefully consider your investment objectives, level of experience, and risk appetite, and seek professional advice where needed.
Fusion Media would like to remind you that the data contained in this website is not necessarily real-time nor accurate. The data and prices on the website are not necessarily provided by any market or exchange, but may be provided by market makers, and so prices may not be accurate and may differ from the actual price at any given market, meaning prices are indicative and not appropriate for trading purposes. Fusion Media and any provider of the data contained in this website will not accept liability for any loss or damage as a result of your trading, or your reliance on the information contained within this website.
It is prohibited to use, store, reproduce, display, modify, transmit or distribute the data contained in this website without the explicit prior written permission of Fusion Media and/or the data provider. All intellectual property rights are reserved by the providers and/or the exchange providing the data contained in this website.
Fusion Media may be compensated by the advertisers that appear on the website, based on your interaction with the advertisements or advertisers.
© 2007-2024 - Fusion Media Limited. All Rights Reserved.