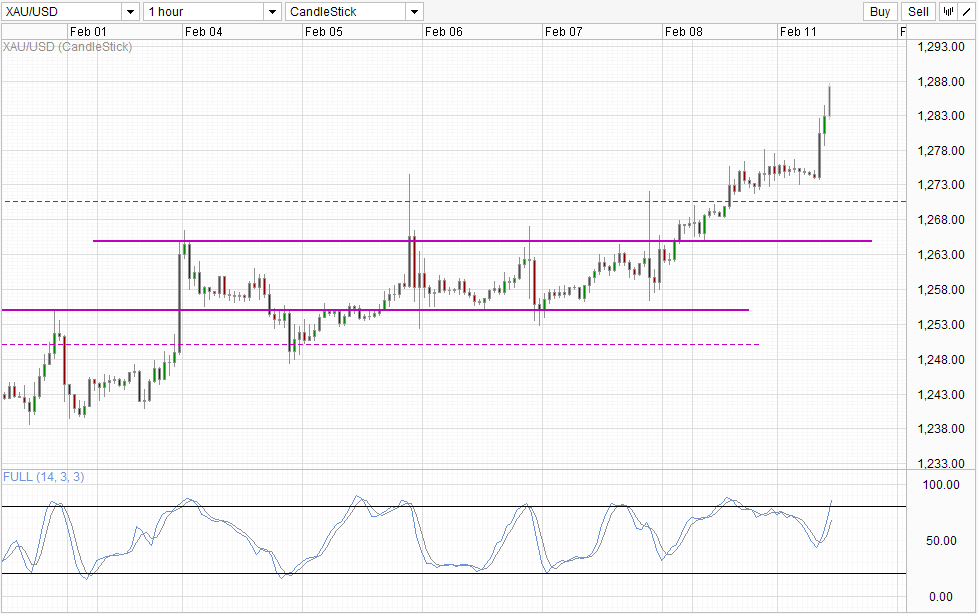
Yesterday's analysis showed that bears are no longer seen above 1,265 (or at least not in as large numbers as before), making this officially bull country. Traders didn't take advantage of this during US session yesterday, and that is reasonable as anybody venturing into new territory would be cautious, especially an area where bears were previously seen. However, once traders noticed that bears are indeed missing in action (confirmation of price unable to push below 5th Feb Swing high), we started to see bulls rampaging, bringing us to current high of 1,287, with resistance 1,290 in sight.
Hourly Chart
Considering that there there wasn't any major news announcement during Asian hours, we can safely say assert that current rally is based on pure market sentiment alone. This is especially true when we consider that risk trends is actually bullish right now, and that should be a bearish factor for Gold prices as safe haven flow should be exiting into riskier assets such as Stocks. Certainly it is possible that the entire market is still running on stimulus speculation, but that is also not a strong reason for continued gold appreciation as market should already have digested and discounted this perspective yesterday following a depressing NFP print on Friday. It would be akin to beating a dead horse if market is still buying Gold because of this, and the risk of a pullback becomes higher in absences of any other news event/numbers that can support this perspective. Fed's new Chariman Yellen's testimony to the House of Representatives later today can be one of those "event risk", but as Yellen is not expected to be overtly dovish about continuing current QE stimulus package, a huge downside risk for Gold remains.
From a technical perspective, current bullish momentum is already Overbought but there is no evidence that a reverse is happening anytime soon. Nonetheless, a reversal - whether in the form of a dip or a more significant correction is in the cards, and traders need to be mindful of this heading into today's event risk.
Daily Chart
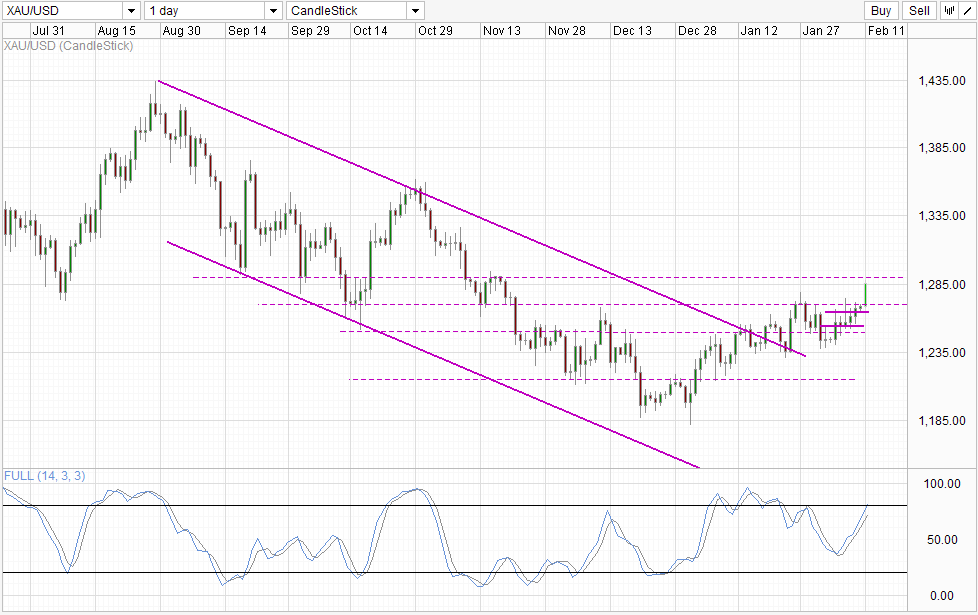
Daily Chart suggest that the bullish recovery from 1st Jan 2014 is alive and well. If 1,290 is indeed broken, we can look forward to a potential push towards previous swing high of 1,362 formed on 29th Oct if 1,300 and 1,315 resistances are broken. However, the same problem remains - momentum is Overbought. This is not a damning issue for bulls, but given all the resistances lying in wait, certainly more fundamental bullish factors will be welcomed, while any potholes (e.g hawkish Yellen's speech later) may easily derail current recovery efforts against a strong long-term bearish backdrop.


