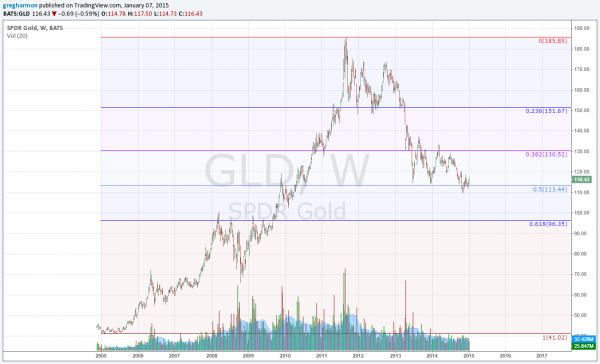
Gold has been pulling back from a long run higher since peaking in 2011. In a best case scenario it may be basing or consolidating following the 3 year pullback, as it keeps bouncing off at the 50% retracement of the move higher. No signs of life though in this weekly chart. No reason to buy it. And quite possibly just a pause until it continues lower. So why did I buy Call Butterflies Wednesday, a bullish trade? Timeframe.
I do believe that Gold (ARCA:GLD) could continue to run lower maybe even down to the 61.8% retracement in the chart above or further. But in the very short run, in fact only until the end of next week, the paper version of the shiny rock looks well positioned to move higher.
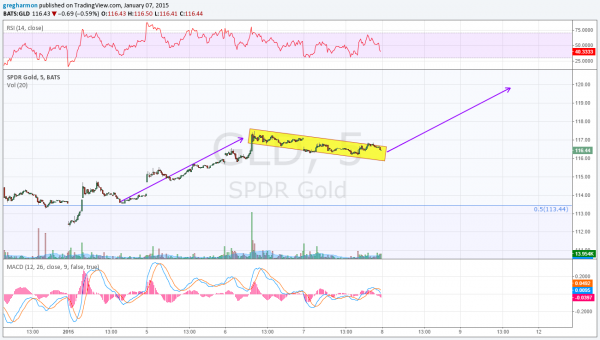
The short term chart above gives the first clue. This is a 5 minute chart, used by short term traders. What it shows is that Gold moved higher off of a short term bottom, and has now been pulling back in a bull flag. A break of this flag would target a move to 120 on a continuation higher.
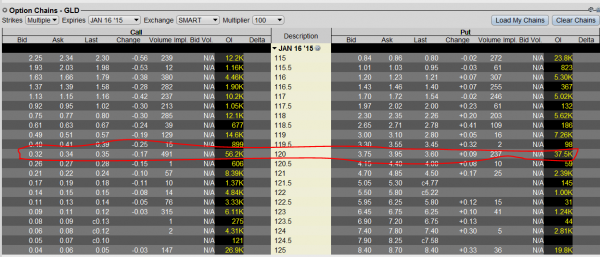
The second clue comes from the options chain for January Expiry below. It shows a very large footprint at the 120 Strike next week with 56.2k open Calls and 37.5k open Puts. These are the largest by far. This kind of large open interest can often act as a magnet for the stock at Expiry, if it is in the vicinity. I have written more about them here and the Options Industry Council website describes them here.
This makes two possible reasons for Gold to move to 120 in the short run. That option chains also offers a cheap way to participate in the move via a structure called a Call Butterfly. This is a long Call Spread and a short Call Spread, at the same expiry with the short spread at higher strikes than the long one. It also has the same difference between the spreads.
Butterflies are used to pinpoint a stock move and lower the cost, with no downside other than the premium at risk. The trade I chose was a January 117.5/120/122.5 Call Butterfly. Buying a 117.5/120 Call Spread and Selling a 120/122.5 Call Spread. This cost me 45 cents, and has a maximum payout at 120 of $2.50. That is a better than 5:1 reward to risk ratio.
This goes to show you can be both bullish and bearish at the same time.


