Hourly Chart XAU/USD Hourly" title="XAU/USD Hourly" align="bottom" border="0" height="242" width="474">
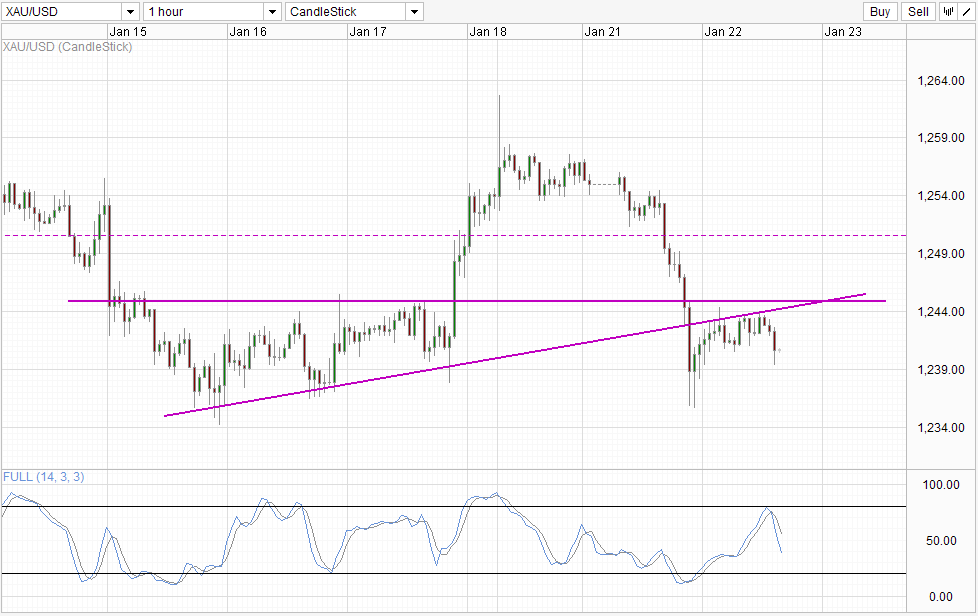
Gold prices remain bearish despite the sudden "risk off" move during the early US session yesterday. Prices did rebound from yesterday's low of 1,236 - around the lows on various occasions between 15th - 17th January, but that is also capped below the rising trendline and is currently moving towards 1,236 once more. Stochastic readings agree with the bearish cycle signal currently in play, increasing the probability of price tagging 1,236 before we see a significant pullback.
This weakness in Gold is in line with broad long-term fundamentals that do not find any satisfactory reasons for investors to buy gold. Nonetheless, considering that Gold was actually bullish earlier in the week, it is interesting to see how quick the tables have turned even though Hedge Funds/Institutional speculators have supposedly bought more Gold according to latest CFTC data. This week's COT numbers will be important so that we will be able to see if these institutional traders/investors are still interested in Gold. If Net Long positions continue to climb, the likelihood of 1,236 holding increases, and we could even see a move towards 1,255 and beyond (assuming that we have not reach the 2 levels mentioned before the COT numbers are released).
Daily Chart
 XAU/USD Daily" title="XAU/USD Daily" align="bottom" border="0" height="242" width="474">
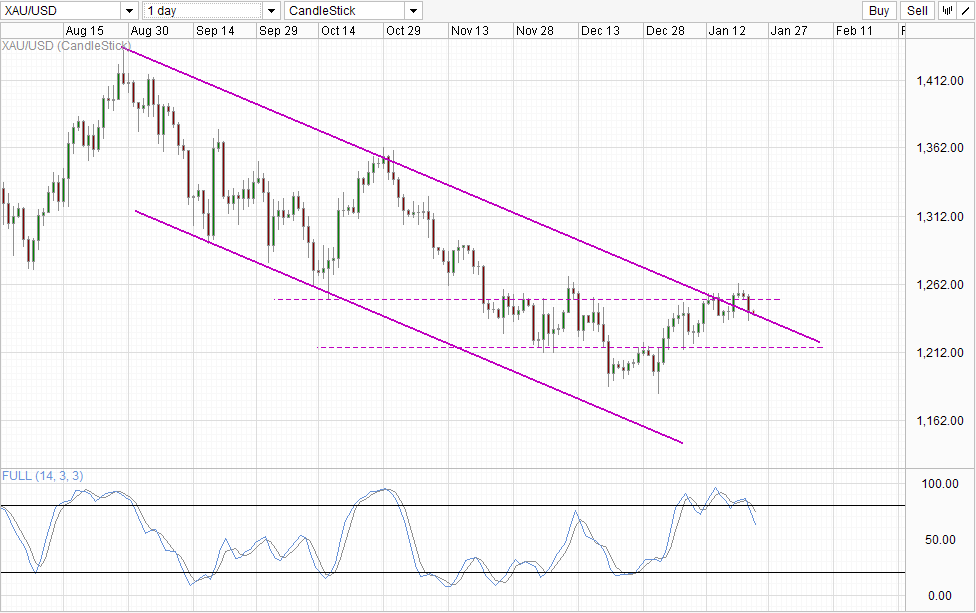
Long term direction is bearish even though prices have broken above the descending Channel Top. The inability to climb above the swing high of Dec 2013 and staying above 1,250 round figure suggest that we are rather far away from any bullish breakout that can take us closer to 1,300. This opens up a return of the previous swing low, 1,182, as a viable long-term target. Certainly price may still rebound from the descending trendline, but given current bearish momentum and bearish fundamentals, the higher likelihood may be price straddling the Channel Top lower. Should price trade below the Channel Top, we could even see bearish acceleration as the bullish pullback started in late December/early January will be fully invalidated, giving full initiative to bears. Stochastic readings agree with a fresh bearish cycle with Stoch levels already below the peak formed in December. The next significant level of support for Stoch would be the 50.0 mark seen between September and October 2013. This provides enough space for price to head lower, but it is likely that bears will find significant support when 1,215 is reached.
