Here is what I said about Lead on 13th January 2017.
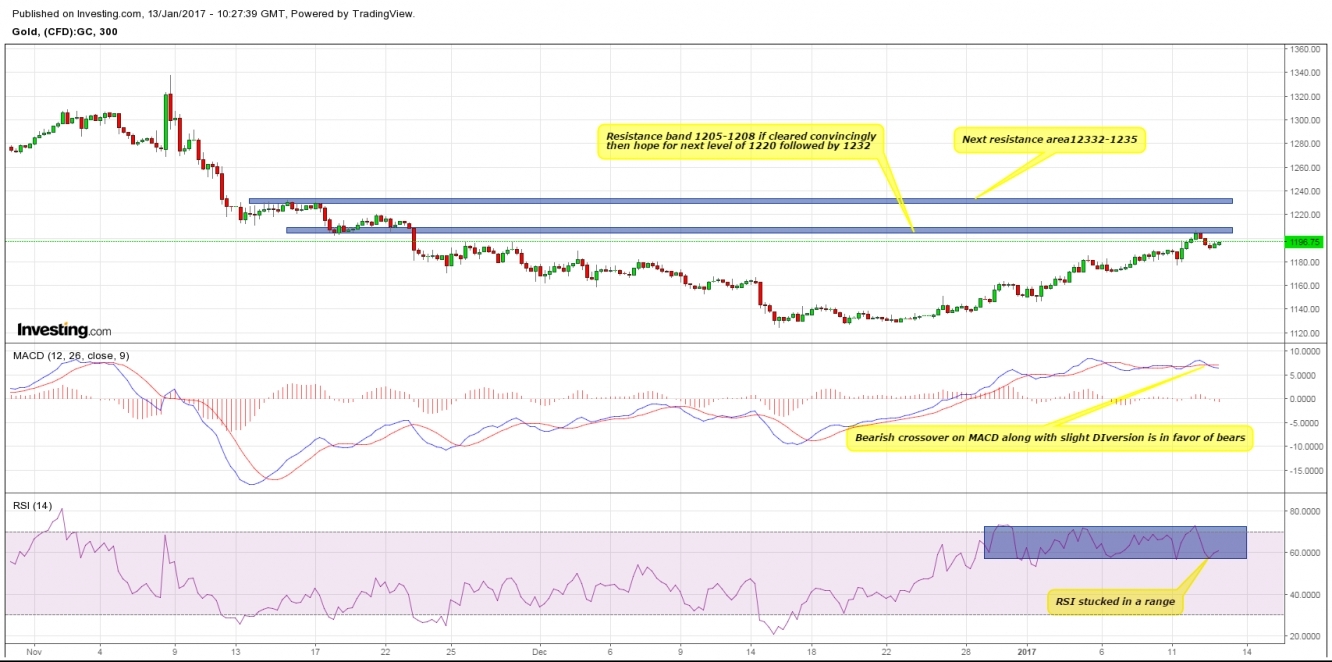
Here is the previous chart, reproduced below:

Gold clears the resistance of 1205 and moved towards the next area of resistance of 1220. So far the high printed by this yellow metal is 1218 and currently trading at 1215 at the time of writing.
Let’s have a look at the larger picture:
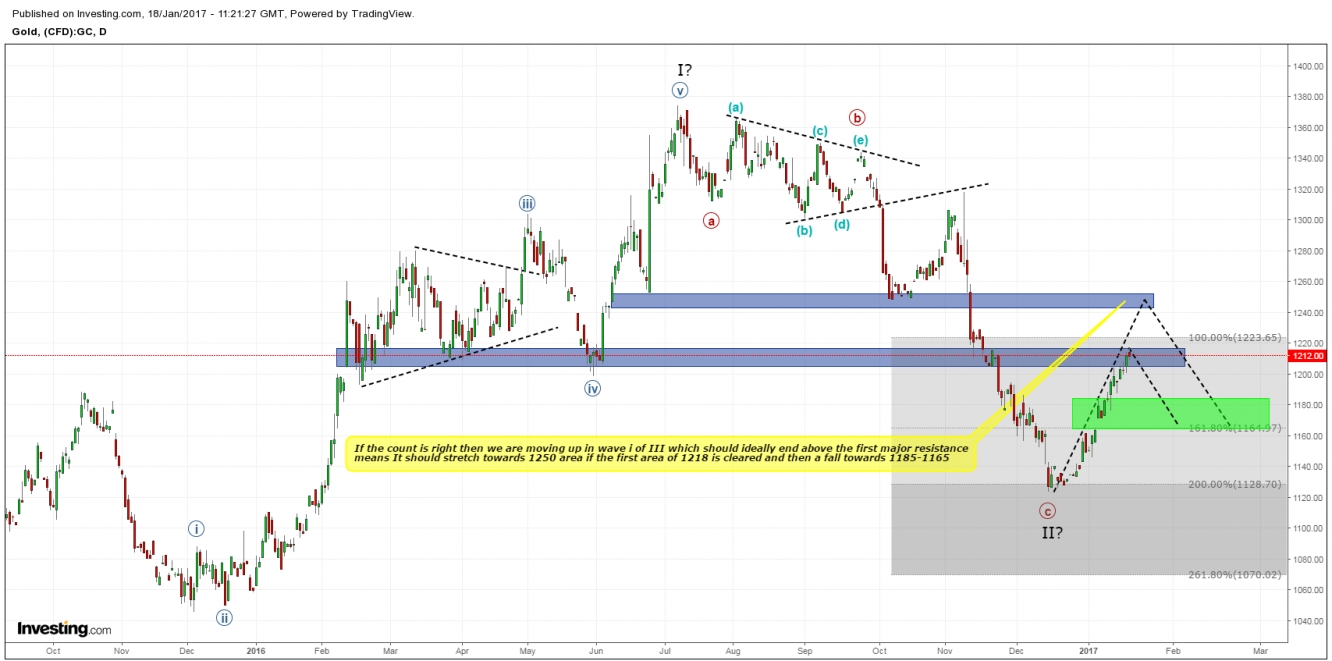
Here is the daily gold chart below showing my preferred wave count (only major level count revealed here, minute waves are shown here in this chart given below.)

If we have clear five wave up then this current slide from 1375 level is corrective ABC or simply wave II.
According to rule no. 2 the correction in wave II can never retrace the entire move of wave I.
In most cases wave II stops around the 61.8% of previous wave but in this case gold has already printed a low of 1123.90 (below the 61.8% and just above 75% of previous move) without any serious diversion on daily chart which should have been reflected by the indicators in progress of wave C, which has been a major concern between Elliot wave traders in this melt down.
Now we are 90$ above from the low and majority of the traders still thinks that this up-move is nothing but a dead cat bounce to provide another selling opportunity (quote from the book of A.J. Frost and Robert Prechter: Wave 2 bears the property to change the mind of normal public, Fundamental conditions often as bad as or worse than those at the previous bottom. Underlying trend considered down but it does not carry to new low)
Everything is according to classical Elliot text book for Bullion.
1-Fed wants to raise rates thrice this year. (Negative for bullion)
2-DX is in uptrend. (Negative for bullion)
3-No one wanted to buy at the lower rates of 1130 because everyone is convinced that they will get it around 950-850$ or even lower.
(Let me make it very clear that I am not advocating for any theory here for buy or sell I am just saying what I have read and practicing, nothing else.)
According to my preferred count we are moving up in wave (i) of wave III and this first wave should end either after clearing the first resistance around 1220-1232 or after clearing the next major Resistance of 1245-1250 and then a pullback of 50-61.8% of this entire move from 1124.
If this wave count is right and really we are in the initial stages of wave III then our preferred target area (if extension is missing: as normally happens in case of commodities) for wave III is 1458.00 in case of equality from wave I and 1660+ in case of 1.618% of wave I
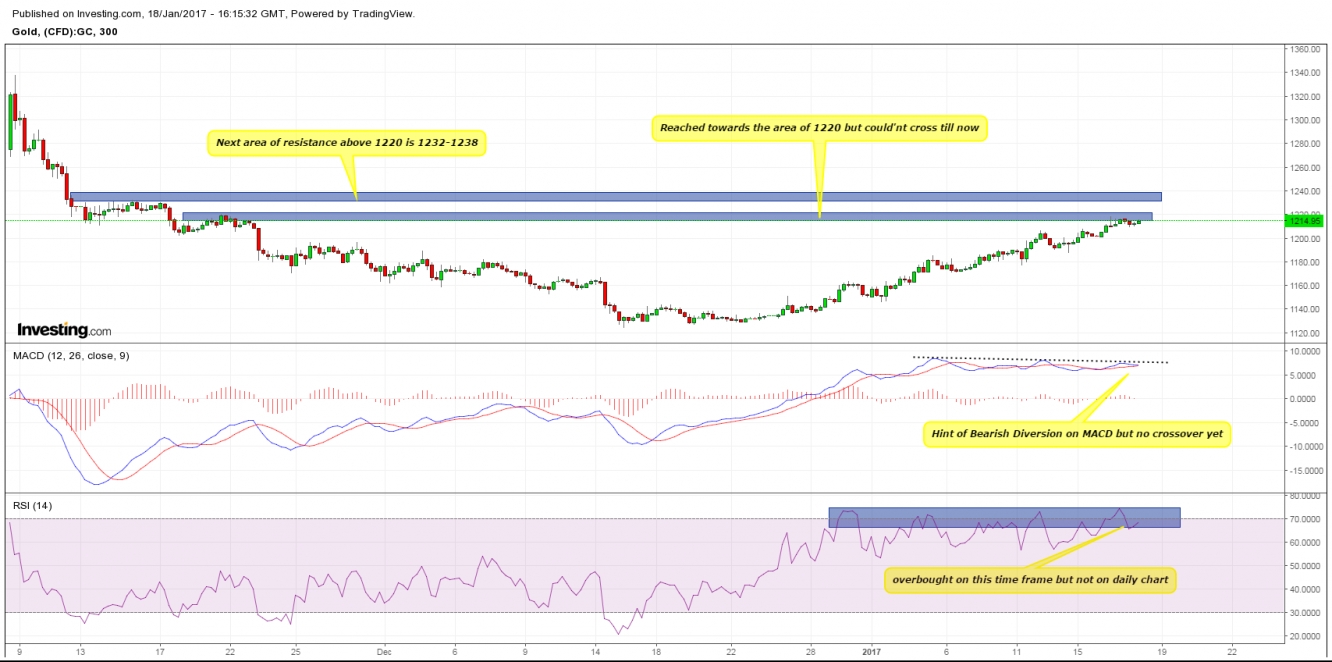
Let’s move towards the 5Hr time frame for short term trading objective: 
RSI is in over bought zone from last few hours.
MACD is in favor of bulls but reflecting bearish hint of bearish diversion which is normally associated with the formation of wave (i), it looks like that Gold is resuming its uptrend again after a correction in wave 2. Right now it is trading around 1215 at the time of writing and already near the first resistance zone and looks ready to challenge the next zone of 1232-138 followed by 1250 area (visible on daily chart) before completion of wave I of III.
MACD is in favor of bulls but RSI is already in overbought position hence longs need strict stops to cap the gains as correction is a possible scenario here.
Resistance: 1220/1232/1238
Support : 1205/1192/1180
