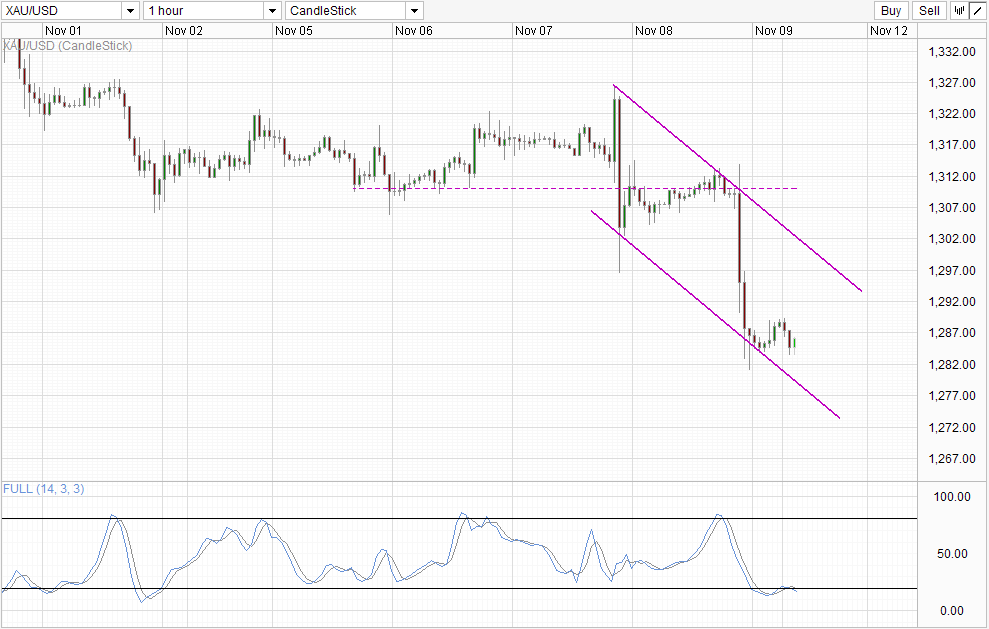
Last Friday's US Non-Farm Payroll gave Gold the bearish push that we've been looking for, sending prices resolutely below 1,300.
Generally there is a fear that such news-inspired moves may not simply be a one-time correction/overreaction. In this case the likelihood of this happening is even higher, as prices were actually trending sideways above 1,306 between Monday and Thursday. Bears did push below 1,300 briefly on Thursday, but the price recovered quickly and traded sideways once again - giving the impression that prices would have continued trading sideways if not for the NFP push.
Hourly Chart XAU/USD Hourly Chart" title="XAU/USD Hourly Chart" height="629" width="989">
In this regard, this morning's bearish move is a good confirmation that a bullish pullback is not in play right now. However, prices are still some distance from breaking 1,284 - 1,285 the soft support from last Friday, post NFP. Only by trading below the aforementioned level then would further bearish conviction be confirmed. Without which, the chance of prices pushing up towards 1,290 increases - this does not necessarily mean that price would automatically push up higher but certainly the chances of price action reverting to the pre-NFP sideways trend increases.
Unfortunately for bears, the bearish momentum does appear to be stretched with Stochastic readings within the Oversold region. Even though this morning's decline prevented a bullish cycle signal from emerging, the additional allowance given most likely will be utilized fully when prices hit the Channel Bottom, increasing the likelihood of a move back higher eventually. Nonetheless, with the overall short-term bias remaining bearish, there is a chance that prices may still straddle the Channel Bottom lower instead of rebounding higher, but that would mean that Stochastic readings will remain extremely Oversold - not an impossibility but certainly a unwelcome monkey on the backs of those who are trading the 1,284 - 1,285 breakout.
Weekly Chart XAU/USD Weekly Chart" title="XAU/USD Weekly Chart" height="629" width="989">
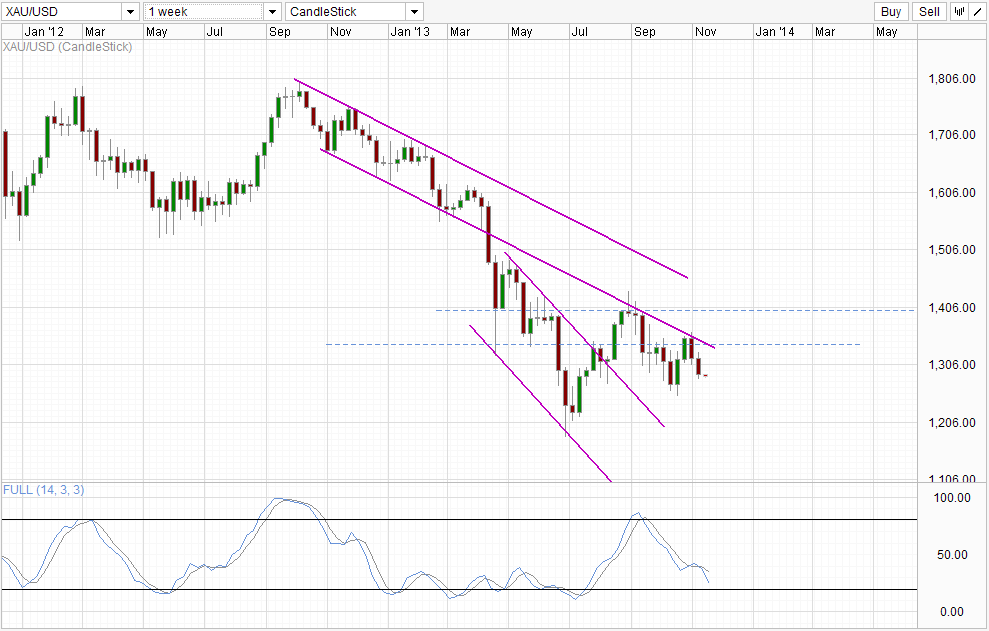
The Weekly Chart suggests that bearish momentum is in play, extending the Channel Bottom bearish rejection that occurred 2 weeks ago. However, even Stochastic indicators here suggest that prices may not be able to extend the current bearish run for much longer as readings are close to the Oversold region already. Hence, a move all the way towards the Channel Top beneath may be stretching it, and it is likely that prices may find some slight support from the recent swing low around 1,250 - if we even reach there that is.
Original post
- English (UK)
- English (India)
- English (Canada)
- English (Australia)
- English (South Africa)
- English (Philippines)
- English (Nigeria)
- Deutsch
- Español (España)
- Español (México)
- Français
- Italiano
- Nederlands
- Português (Portugal)
- Polski
- Português (Brasil)
- Русский
- Türkçe
- العربية
- Ελληνικά
- Svenska
- Suomi
- עברית
- 日本語
- 한국어
- 简体中文
- 繁體中文
- Bahasa Indonesia
- Bahasa Melayu
- ไทย
- Tiếng Việt
- हिंदी
Gold: 1,300 Broken, Further Bearish Moves Likely
Published 11/11/2013, 12:01 AM
Updated 07/09/2023, 06:31 AM
Gold: 1,300 Broken, Further Bearish Moves Likely
Latest comments
Loading next article…
Install Our App
Risk Disclosure: Trading in financial instruments and/or cryptocurrencies involves high risks including the risk of losing some, or all, of your investment amount, and may not be suitable for all investors. Prices of cryptocurrencies are extremely volatile and may be affected by external factors such as financial, regulatory or political events. Trading on margin increases the financial risks.
Before deciding to trade in financial instrument or cryptocurrencies you should be fully informed of the risks and costs associated with trading the financial markets, carefully consider your investment objectives, level of experience, and risk appetite, and seek professional advice where needed.
Fusion Media would like to remind you that the data contained in this website is not necessarily real-time nor accurate. The data and prices on the website are not necessarily provided by any market or exchange, but may be provided by market makers, and so prices may not be accurate and may differ from the actual price at any given market, meaning prices are indicative and not appropriate for trading purposes. Fusion Media and any provider of the data contained in this website will not accept liability for any loss or damage as a result of your trading, or your reliance on the information contained within this website.
It is prohibited to use, store, reproduce, display, modify, transmit or distribute the data contained in this website without the explicit prior written permission of Fusion Media and/or the data provider. All intellectual property rights are reserved by the providers and/or the exchange providing the data contained in this website.
Fusion Media may be compensated by the advertisers that appear on the website, based on your interaction with the advertisements or advertisers.
© 2007-2024 - Fusion Media Limited. All Rights Reserved.