Gold With A Double Top On The 23,6% Fibo

Published 09/17/2018, 06:22 AM
XAU/USD
-
GC
-

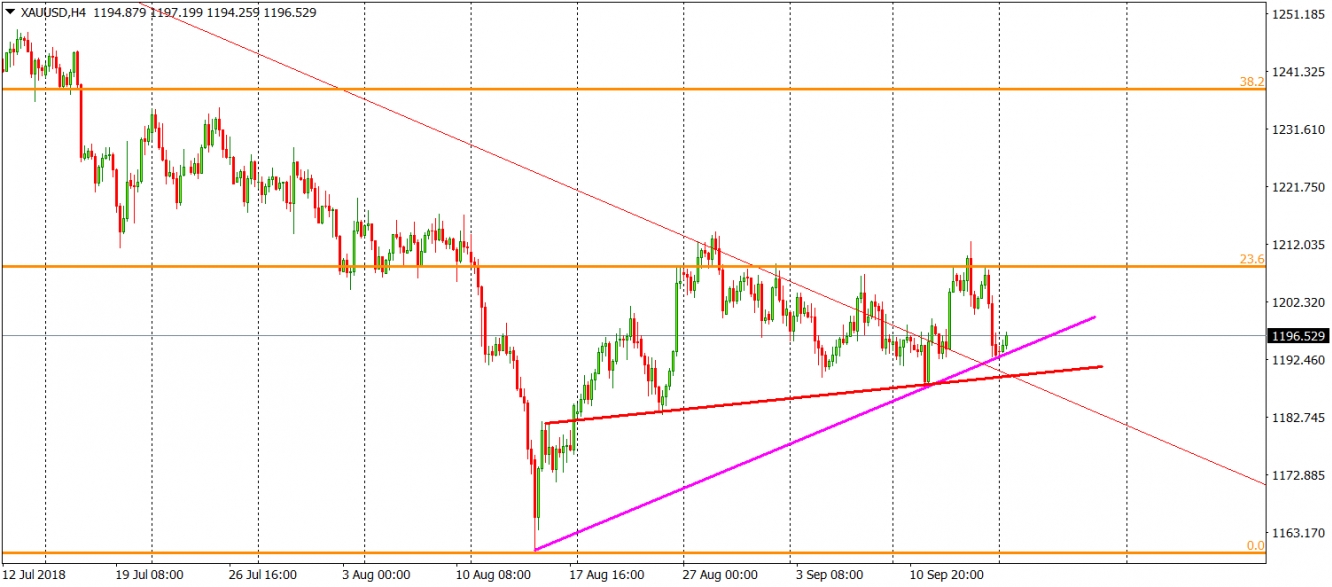
Gold is really struggling to climb any higher. Buyers had great hopes and they still have great intentions but they just cannot increase the momentum after the bounce from the middle of August. Many traders are thinking that 1160 USD/oz is a hard bottom and we should not get any lower.


The correction that started on the 16th of August, stopped on the first important Fibonacci level -23,6%. Bulls tried to break that area twice and both times were unsuccessful. That creates potentially a very negative situation here. To estimate what will be the future of Gold, we need to carefully observe two dynamic supports. First one is mid-term up trendline (pink) and second one is the neckline of the double top formation (orange). As long as we stay above those two, buyers can still have hope.


Bearish breakout of those supports will bring us a strong sell signal and most probably a reversal. After the bounce from Friday (additionally shaped like a head and shoulders formation), chances for that are quite high.

Gold Chart

Latest comments

Loading next article…
Risk Disclosure: Trading in financial instruments and/or cryptocurrencies involves high risks including the risk of losing some, or all, of your investment amount, and may not be suitable for all investors. Prices of cryptocurrencies are extremely volatile and may be affected by external factors such as financial, regulatory or political events. Trading on margin increases the financial risks.
Before deciding to trade in financial instrument or cryptocurrencies you should be fully informed of the risks and costs associated with trading the financial markets, carefully consider your investment objectives, level of experience, and risk appetite, and seek professional advice where needed.
Fusion Media would like to remind you that the data contained in this website is not necessarily real-time nor accurate. The data and prices on the website are not necessarily provided by any market or exchange, but may be provided by market makers, and so prices may not be accurate and may differ from the actual price at any given market, meaning prices are indicative and not appropriate for trading purposes. Fusion Media and any provider of the data contained in this website will not accept liability for any loss or damage as a result of your trading, or your reliance on the information contained within this website.
It is prohibited to use, store, reproduce, display, modify, transmit or distribute the data contained in this website without the explicit prior written permission of Fusion Media and/or the data provider. All intellectual property rights are reserved by the providers and/or the exchange providing the data contained in this website.
Fusion Media may be compensated by the advertisers that appear on the website, based on your interaction with the advertisements or advertisers.
© 2007-2025 - Fusion Media Limited. All Rights Reserved.