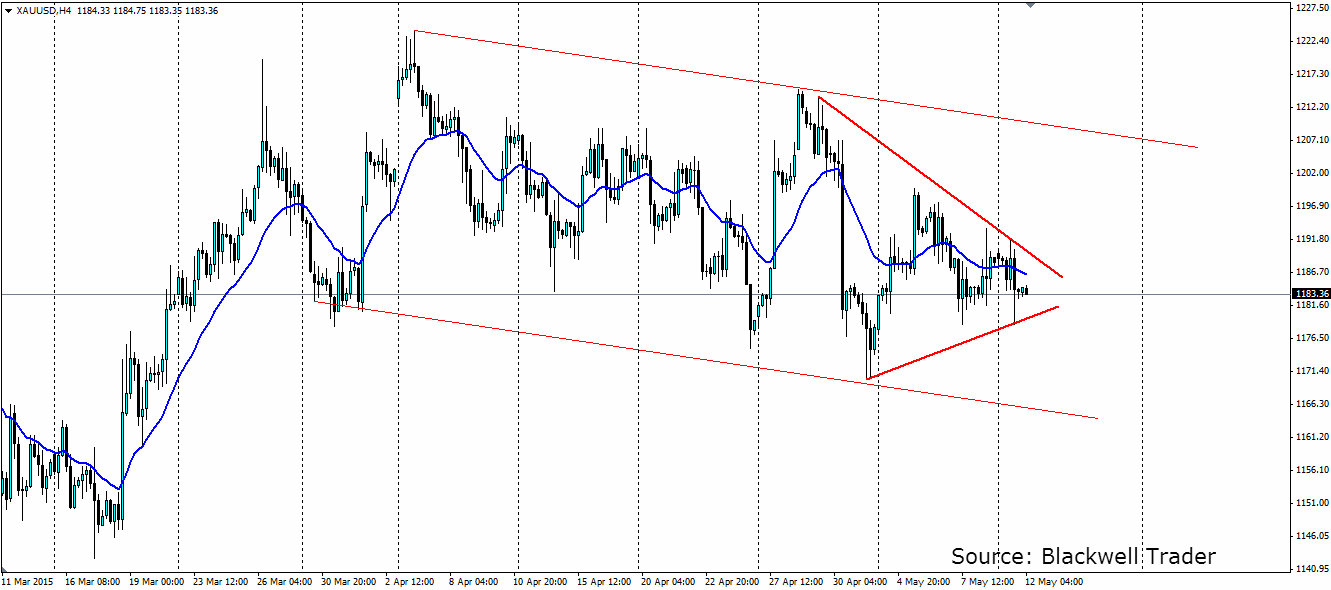
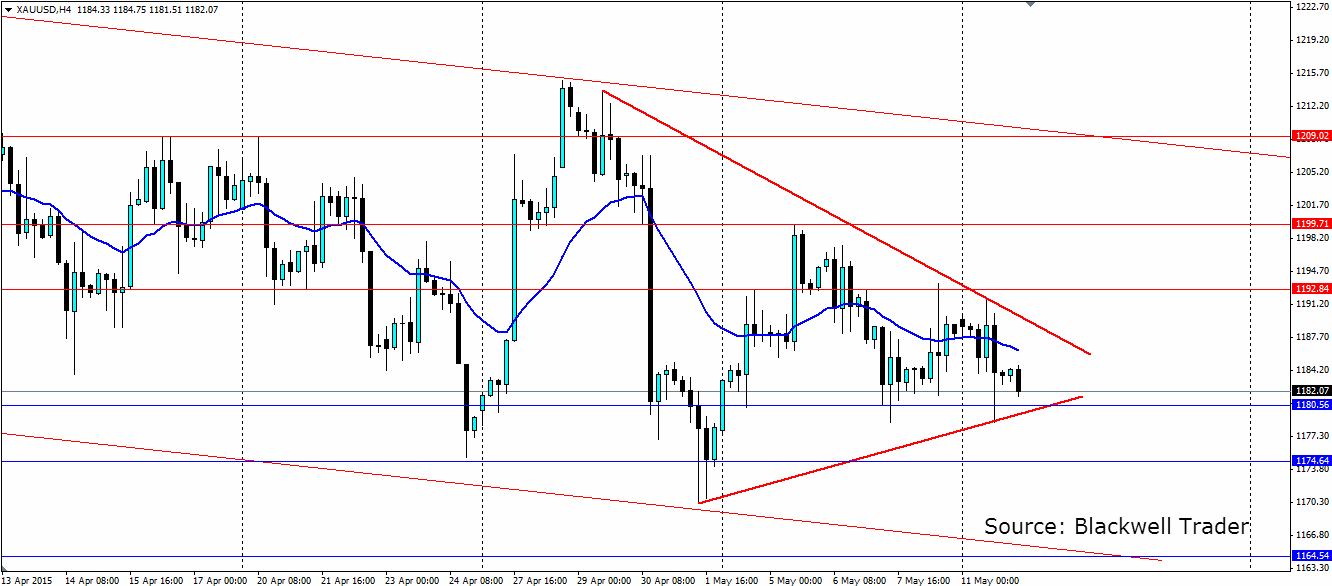
Gold prices have been ranging quite consistently over the last month and have formed a bearish channel. Prices are beginning to consolidate into a wedge pattern, and given the risks around at the moment, the right nudge will result in a sharp breakout.

Gold traders are playing the waiting game. That is evident by the fact that since the end of May, gold has not pushed higher than $1,224.06 an ounce, nor lower than $1,181.99. The range that gold has remained in has a clear bearish bias, but only slightly. The waves within the channel have been trending lower, but there have been plenty of opportunities for traders to play each wave, both up and down.
The risks in the global market are quite apparent for gold at the moment. Greece is a big issue at the moment and could go belly up at any point,if that is the case gold will certainly benefit from the flight to safety. Further upside risks come from the proxy war in Yemen that threatens to spill over into neighbouring countries and drag bigger powers into it.
In a speech by Janet Yellen last week she said that US equities were overvalued, but not a bubble. Read into that what you want, but the risk is apparent and if we see a serious correction in equities, expect gold to lift as that cash looks for a home. This could come about if the economic data out of the US continues to look weak, as it has done over the last month; for example, US GDP took a dive to 0.2% q/q from 2.2%, and the US Trade Balance fell to -$51.4b from -$35.4b.
The biggest downside risk to gold is if the US Federal Reserve surprises the market by lifting interest rates. The chances of a rate rise in June have decreased considerably thanks to the economic data weakening, but the desire of the Fed to normalise rates is still there. September looks the likely month for a rate rise, provided things pick up in the US.
Finally Greece again, if a deal can be reached between Greece and its lenders, the IMF and the ECB, we may see gold suffer and look to target the lower end of the channel as the market takes a risk on approach.

The consolidation see on the gold charts in the short term is likely to lead to a breakout. The direction of the breakout will likely depend on one of the risk factors outlined above. An upside breakout will target resistance at 1192.84, 1199.71 and 1209.02 with the upper level of the channel acting as dynamic resistance. A breakout lower will find support at 1180.56, 1174.64 and 1164.54, again with the channel acting as dynamic support.
Gold faces plenty of risks over the coming months and just one of these could force a breakout of the current consolidation pattern.
