Dominic Frisby explains why, despite media claims, the gold price in the last 12 years has actually been quite orderly and why gold is likely to see further pullbacks. However, this is not a reason to abandon your gold bullion investment. Mr Frisby explains that, whilst both the gold and silver price might cause some pain in the short-term, he expects to see them both testing new highs by the end of the year, suggesting now might be a good time to buy gold bullion and invest in silver.
Gold is sticking to the plan
My big theme of the past year has been that gold has been in consolidation mode, and that we would not see new highs before this autumn at the earliest.
Gold made a mini-parabolic move last summer, which coincided with a panic (one of the many) over Greece. It finally spiked in September 2011 to $1,920 an ounce. It then corrected sharply by about 20% to $1,520, with many leveraged players losing their metaphorical shirts.
The move towards $1,920 saw all sorts of mainstream coverage. Yours truly even made it on to BBC Radio 2′s Drivetime show. With the subsequent 20% fall, the clichés were dusted off. Gold, we were told, had ‘lost its lustre’ and the bull market was declared over.
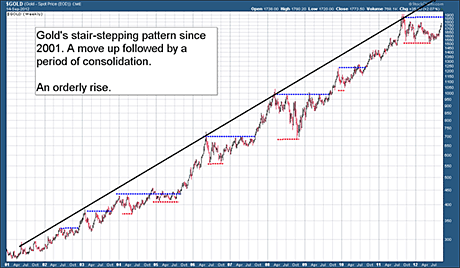
But gold was simply doing what it has repeatedly done since this bull market began. It enjoys a run up, which might last some six or nine months and see gains of as much as 40% or 50%, then it trades sideways for a while, retracing some of the move up and consolidating at these higher prices. The length of the consolidation period usually reflects the magnitude of the previous run up.
You can see this illustrated in the chart below. For all the daily volatility, for all the squabbling, shouting and screaming, gold’s rise over the last 12 years has actually been quite orderly.
The black line marks the upper reaches of gold’s channel. The dotted blue lines show the periods from an intermediate high in gold before it breaks out to a new high. The dotted red lines show the shorter periods from an intermediate high to an intermediate low – which often occurs at the point of a previous high.
Gold’s intermediate-term highs, most of them marked by the black line, have been at $293, $384, $430 and $450, $728, $1,033, $1,225 and $1,920. And each time it makes such a high, we go into consolidation mode – which is where we are now.
However, the period between intermediate-term high and low – as shown by the dotted red lines – is considerably shorter. And the good news is it looks like we’ve made our intermediate-term low now at $1,520.
Gold has re-tested that level three times now, and each time it has held. At the MoneyWeek conference back in May I was dribbling on about how important that number $1,520 is. I’m delighted to see it has held, as I hoped it would.
On this basis, we might still have several months before gold re-tests its old high at $1,920. I would also have thought it will take a few attempts to get through this level.
Then again, we might not. Gold, following the coat-tails of silver, is off on one of its runs again. It’s gone through every level of resistance as though it wasn’t there, rising every day by a percent or two (silver is actually up by over 20% in 30 days).
A marked acceleration came last week with Federal Reserve chief Ben Bernanke’s latest announcement. When gold goes on one of these runs, nothing seems to stand in its way.
Three reasons why gold might slip back in the short term
That said, here are three reasons we might expect some sort of short-term pullback for gold.
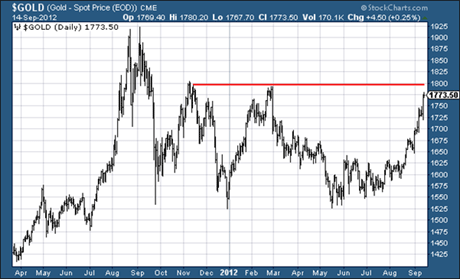
First, it is approaching a big line of resistance at just below the $1,800 mark, as shown by the red line on the next chart below.
Given the action we have seen since the end of July, I would wager that we are bound to see some kind of breather. There are so many traders who will have had such a good couple of months, profit taking is inevitable, even as soon as this week – on the stocks as well as the metals themselves.
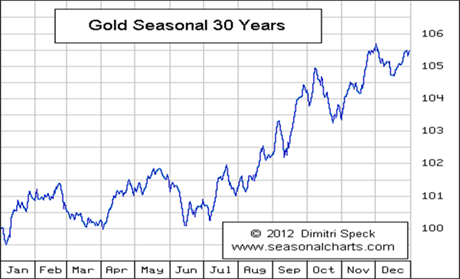
Second, we always seem to see some kind of shake-out either in late September or early October. You can see this on Dimitri Speck’s seasonal chart, shown below. (The chart basically shows that over the last 30 years, gold has generally had a fall during these months).
Third, there is a heck of a lot of bullish sentiment about gold and silver all of a sudden. Since the latest Fed announcement of apparently unlimited quantitative easing (QE), a number of people – many of whom I have great respect for – are declaring that “this is it”, “this is the beginning of the end-game”, “Von Mises’ crack-up boom, here we come”, and the like.
(“Crack-up boom” refers to the economist Ludwig Von Mises’ oft-quoted line: “There is no means of avoiding the final collapse of a boom brought about by credit expansion. The alternative is only whether the crisis should come sooner as the result of a voluntary abandonment of further credit expansion, or later as a final and total catastrophe of the currency system involved.”)
If there is one thing I’ve learned, it’s that this ‘end-game’ is going to be a lot longer in coming than most of us ever expect. (I thought it was coming in 2008). Markets can remain irrational a lot longer than you can remain solvent, and all that.
When you hear these kinds of pronouncements, it often pays not to listen to them. There’s no doubt that the stances of the world’s central banks are extremely inflationary and bullish for gold, but the expectation for stimulus was, to at least a degree, priced in. Perhaps this is a moment to “sell the news”.
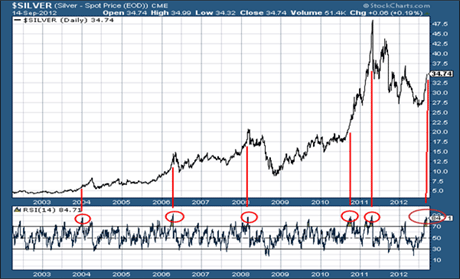
To illustrate this excess of bullish sentiment, I’d like to show you a long-term chart of silver (see below). Underneath it is the ‘relative strength index’ (RSI), which compares the magnitude of recent gains compared to losses, in order to determine whether an asset is overbought or oversold. I have circled the RSI when it has reached similar levels to where we are today.
On a short-term basis, silver is overbought.
Does this mean you should all run out and sell your gold and silver? Absolutely not. On a longer-term basis, the RSI is actually quite moderate.
But on a shorter-term basis, I would have thought some kind of shake-out is likely. But it will be like some short, sharp punch in the ribs. Enough to rattle everybody’s nerves and cause a bit of pain. That’s assuming it happens at all of course.
Longer-term, I stick with my big picture call. We are still in consolidation mode, but we are starting to head out of it. The worst of the correction is over. Some kind of wake-up punch might be coming, but I’m hoping to see those $1,920 highs in gold re-tested before the end of the year, with a new high next year well into the $2,000s.
Please Note: Information published here is provided to aid your thinking and investment decisions, not lead them. You should independently decide the best place for your money, and any investment decision you make is done so at your own risk. Data included here within may already be out of date.
- English (UK)
- English (India)
- English (Canada)
- English (Australia)
- English (South Africa)
- English (Philippines)
- English (Nigeria)
- Deutsch
- Español (España)
- Español (México)
- Français
- Italiano
- Nederlands
- Português (Portugal)
- Polski
- Português (Brasil)
- Русский
- Türkçe
- العربية
- Ελληνικά
- Svenska
- Suomi
- עברית
- 日本語
- 한국어
- 简体中文
- 繁體中文
- Bahasa Indonesia
- Bahasa Melayu
- ไทย
- Tiếng Việt
- हिंदी
Gold To $1,920?
Published 09/20/2012, 04:19 AM
Updated 05/14/2017, 06:45 AM
Gold To $1,920?
Latest comments
Loading next article…
Install Our App
Risk Disclosure: Trading in financial instruments and/or cryptocurrencies involves high risks including the risk of losing some, or all, of your investment amount, and may not be suitable for all investors. Prices of cryptocurrencies are extremely volatile and may be affected by external factors such as financial, regulatory or political events. Trading on margin increases the financial risks.
Before deciding to trade in financial instrument or cryptocurrencies you should be fully informed of the risks and costs associated with trading the financial markets, carefully consider your investment objectives, level of experience, and risk appetite, and seek professional advice where needed.
Fusion Media would like to remind you that the data contained in this website is not necessarily real-time nor accurate. The data and prices on the website are not necessarily provided by any market or exchange, but may be provided by market makers, and so prices may not be accurate and may differ from the actual price at any given market, meaning prices are indicative and not appropriate for trading purposes. Fusion Media and any provider of the data contained in this website will not accept liability for any loss or damage as a result of your trading, or your reliance on the information contained within this website.
It is prohibited to use, store, reproduce, display, modify, transmit or distribute the data contained in this website without the explicit prior written permission of Fusion Media and/or the data provider. All intellectual property rights are reserved by the providers and/or the exchange providing the data contained in this website.
Fusion Media may be compensated by the advertisers that appear on the website, based on your interaction with the advertisements or advertisers.
© 2007-2025 - Fusion Media Limited. All Rights Reserved.
