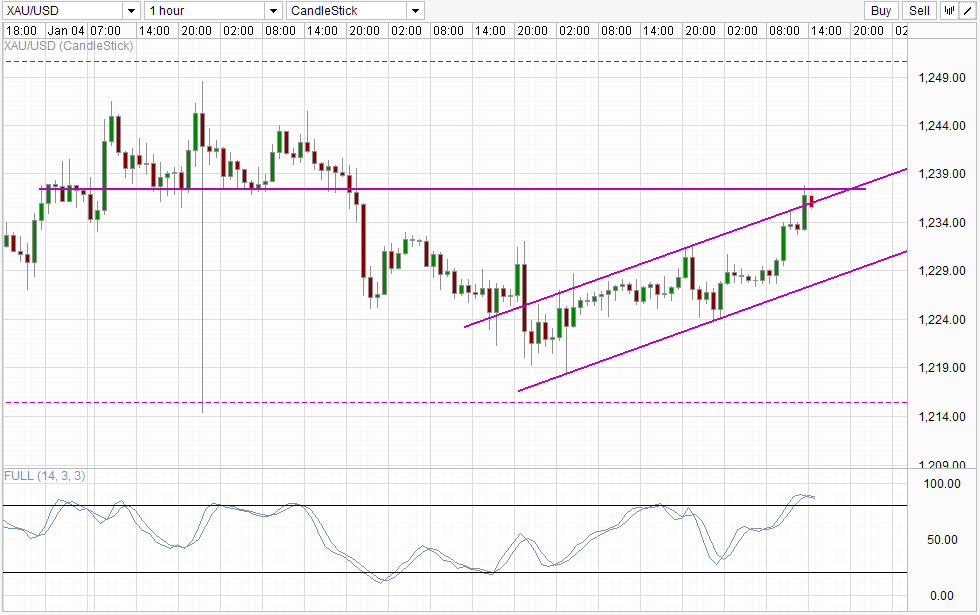
Gold prices received a surprising boost during Asian trade, with prices breaking the 1,232 ceiling that has been keeping bulls in checked for the past 2 days. It is likely that the risk off sentiment which has pushed Asian stocks lower fuelled the gain in Gold as traders seek safe assets for shelter. However, a large part of today's gain may actually be driven by technicals instead. This is because Gold prices continued to rally and managed to hit the former support turned resistance around 1,237.5 despite risk appetite improving during the latter part of Asian trading session. Nikkei 225 managed to reverse a more than 100 point loss to end up almost 32 points higher, while the same could be said of Hang Seng and Straits Times Index, all of which did start off bearishly but are now no longer in the red.
Hourly Chart
Seeing how price is facing resistance from the combine resistance of 1,237.5 and Channel Top, it is clear that technical pressure is stronger than risk trends right now. Given that Stochastic readings are currently within Oversold region and are showing signs of peaking, a move towards Channel Bottom is favoured.
Today's NFP announcement will definitely create volatility which may allow prices to break above 1,237.5 if NFP numbers are worse than expected. However, it is unlikely that price will be able to overcome the ceiling that has been in play on Monday and Tuesday, not to mention the 1,250 round figure resistance just slightly above as price reaction post hawkish FOMC minutes have been mute. As such a weaker than expected NFP number may not trigger relief from so taper fears, as market appears to be insensitive to future tapering knowing that QE will eventually end.
Daily Chart
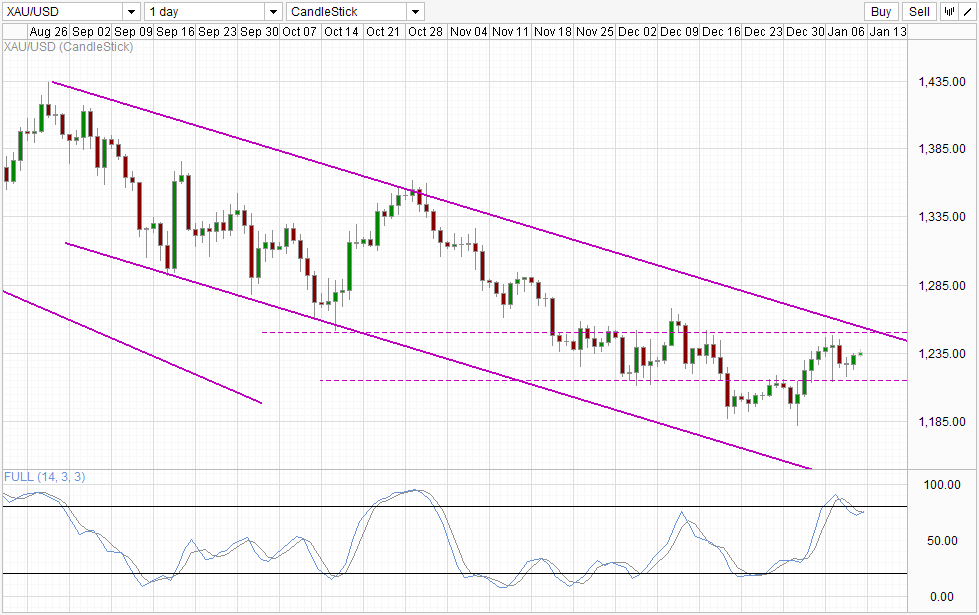
Daily Chart is bearish, but Stochastic readings appears to be bottoming out, and opens up 1,250 and confluence with descending Channel Top as a potential bullish target. However, given the divergence between Stoch peaks and price peaks, bullish signals must be taken with a huge pinch of salt, and what we're seeing from Stochastic could simply be an interim turning point and not an indication of a proper bullish cycle.
Original post
- English (UK)
- English (India)
- English (Canada)
- English (Australia)
- English (South Africa)
- English (Philippines)
- English (Nigeria)
- Deutsch
- Español (España)
- Español (México)
- Français
- Italiano
- Nederlands
- Português (Portugal)
- Polski
- Português (Brasil)
- Русский
- Türkçe
- العربية
- Ελληνικά
- Svenska
- Suomi
- עברית
- 日本語
- 한국어
- 简体中文
- 繁體中文
- Bahasa Indonesia
- Bahasa Melayu
- ไทย
- Tiếng Việt
- हिंदी
Gold Technicals: Bullish Recovery Hits A Snag
ByMarketPulse
AuthorMingze Wu
Published 01/10/2014, 06:17 AM
Updated 03/05/2019, 07:15 AM
Gold Technicals: Bullish Recovery Hits A Snag
Latest comments
Loading next article…
Install Our App
Risk Disclosure: Trading in financial instruments and/or cryptocurrencies involves high risks including the risk of losing some, or all, of your investment amount, and may not be suitable for all investors. Prices of cryptocurrencies are extremely volatile and may be affected by external factors such as financial, regulatory or political events. Trading on margin increases the financial risks.
Before deciding to trade in financial instrument or cryptocurrencies you should be fully informed of the risks and costs associated with trading the financial markets, carefully consider your investment objectives, level of experience, and risk appetite, and seek professional advice where needed.
Fusion Media would like to remind you that the data contained in this website is not necessarily real-time nor accurate. The data and prices on the website are not necessarily provided by any market or exchange, but may be provided by market makers, and so prices may not be accurate and may differ from the actual price at any given market, meaning prices are indicative and not appropriate for trading purposes. Fusion Media and any provider of the data contained in this website will not accept liability for any loss or damage as a result of your trading, or your reliance on the information contained within this website.
It is prohibited to use, store, reproduce, display, modify, transmit or distribute the data contained in this website without the explicit prior written permission of Fusion Media and/or the data provider. All intellectual property rights are reserved by the providers and/or the exchange providing the data contained in this website.
Fusion Media may be compensated by the advertisers that appear on the website, based on your interaction with the advertisements or advertisers.
© 2007-2024 - Fusion Media Limited. All Rights Reserved.
