🐂 Not all bull runs are created equal. November’s AI picks include 5 stocks up +20% eachUnlock Stocks

Gold Technicals: Bullish On Risk Aversion Flows, But Can It Last?

Published 01/24/2014, 06:06 AM
Updated 03/05/2019, 07:15 AM
GC
-

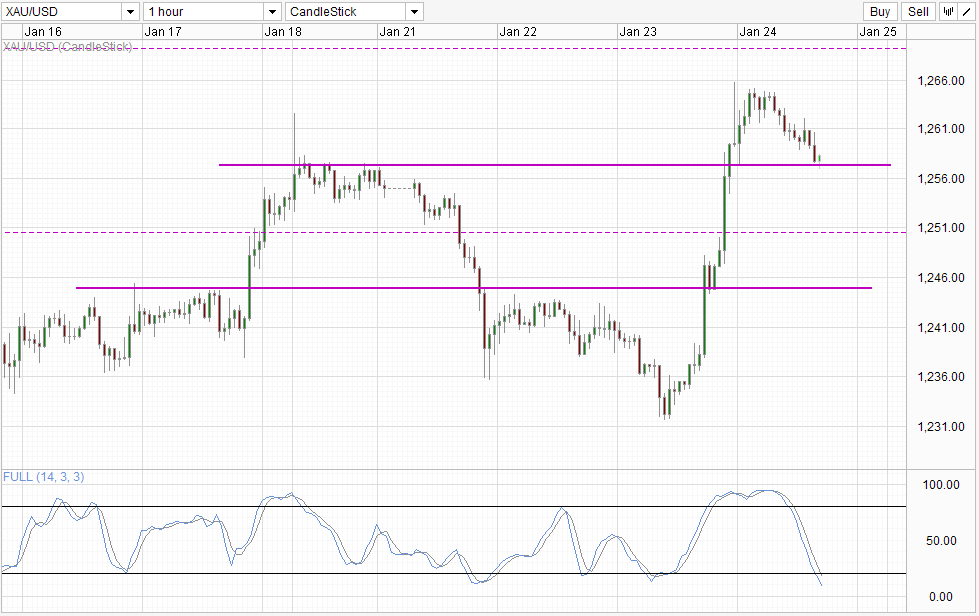
Gold pushed 2.2% higher yesterday as the risk off appetite in stocks drove safe haven assets higher. SPDR Gold ETF received the largest inflow of funds since QE 3 was introduced back in September 2012, highlighting the sudden amount of interest in Gold that allowed the precious metal to hit a high of $1,265.64 per ounce during early US session - forging the longest rally in 16 months.

Hourly Chart
Gold Hourly Chart
Prices have since pulled back, but we are still above the ceiling seen on Monday. Furthermore, Stochastic readings are within Oversold region, increasing the likelihood that the resistance turned support will hold, and a rebound back towards 1,268 and beyond will be possible. A rebound from here will also be in line with bullish momentum that has been in play since the turn of 2014, but all these technical signs do not ease concerns that current rally doesn't seem to fit long-term fundamentals.

Daily Chart
Gold Daily Chart
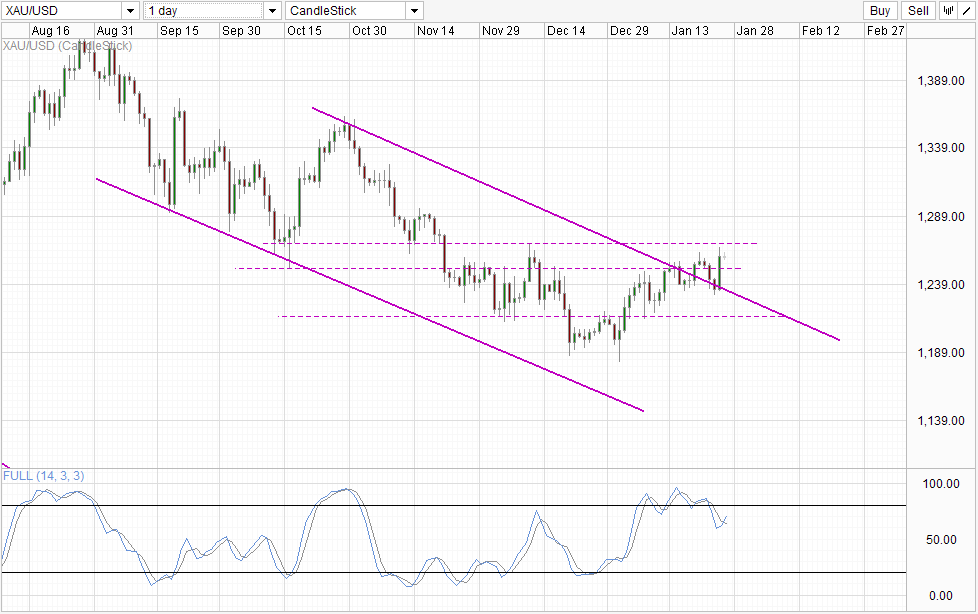
Looking at daily chart, we can see that Gold prices have been trending lower ever since the recent peak made on Sep 2012 - after the announcement of QE3. Prices have been mostly bearish for 2013, but there were still significant bullish recoveries along the way due to short squeeze/institutional speculators buying up Gold at "bargain" prices. Considering that nothing major has changed in fundamentals, the reason for rally seen in 2014 most likely would be of the same mould. This would mean that the likelihood of prices pushing above the previous swing high would be low.

Nonetheless, momentum is still pointing up for now, and daily chart is showing a bullish breakout from Channel Top. Hence, if price manage to breach 1,268, we could see overwhelming technical pressure that can bring us up to 1,300, but beyond that may be difficult considering that Stoch readings are close to Overbought. Furthermore, prices will ideally need to clear above 1,400 before current long-term bearish pressure can be negated. Couple this with bearish fundamentals, it would be hard to maintain a L/T bullish narrative.

Original post

Latest comments

Loading next article…
Risk Disclosure: Trading in financial instruments and/or cryptocurrencies involves high risks including the risk of losing some, or all, of your investment amount, and may not be suitable for all investors. Prices of cryptocurrencies are extremely volatile and may be affected by external factors such as financial, regulatory or political events. Trading on margin increases the financial risks.
Before deciding to trade in financial instrument or cryptocurrencies you should be fully informed of the risks and costs associated with trading the financial markets, carefully consider your investment objectives, level of experience, and risk appetite, and seek professional advice where needed.
Fusion Media would like to remind you that the data contained in this website is not necessarily real-time nor accurate. The data and prices on the website are not necessarily provided by any market or exchange, but may be provided by market makers, and so prices may not be accurate and may differ from the actual price at any given market, meaning prices are indicative and not appropriate for trading purposes. Fusion Media and any provider of the data contained in this website will not accept liability for any loss or damage as a result of your trading, or your reliance on the information contained within this website.
It is prohibited to use, store, reproduce, display, modify, transmit or distribute the data contained in this website without the explicit prior written permission of Fusion Media and/or the data provider. All intellectual property rights are reserved by the providers and/or the exchange providing the data contained in this website.
Fusion Media may be compensated by the advertisers that appear on the website, based on your interaction with the advertisements or advertisers.
© 2007-2024 - Fusion Media Limited. All Rights Reserved.