Gold prices tumbled yesterday, but the decline does not seem to be in line with what most news have reported. If you go to any major financial news provider today, you would see articles that talk about how the stronger than expected US Advance Retail Sales may have increased the probability of the 2nd QE taper in the upcoming FOMC meeting in 2 weeks time. This drove Gold prices lower as the need for inflation protection becomes lower.
This assertion seems to make sense prima facie, but price action does not agree with it. Firstly, the timing is - Advance Retail Sales was released at 8.30am EST (9.30pm SGT), but the sharp decline in Gold happened just before New York Noon. Furthermore, prices of Gold actually traded higher when the numbers were released, pushing steadily up until the sell-off happened. In order for the assertion to fly, prices should have at least traded marginally lower during early US session, instead of higher. Hence, it is clear that Gold prices isn't really influenced by QE tapering, something that has been established previously.
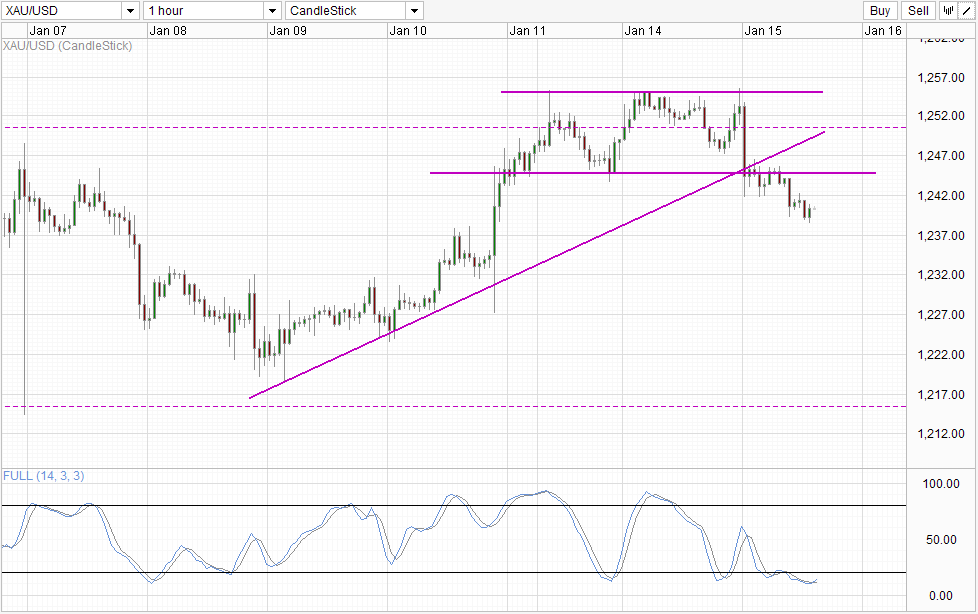
Unfortunately, the alternative argument used on Monday's price action - e.g. risk off appetite sending Gold prices higher - doesn't work either. US stocks actually rallied during early market hours, which would have drove Gold prices lower if the alternative reasoning is correct. That being said, if we ignore the inexplicable early US session rally, risk appetite remains a good explanation for price action yesterday and today. Looking at S&P 500 futures, the decline of Gold from 1,255 high yesterday coincide with the rebounding of the low in S&P 500 after the surprise sell-off in S&P 500 which was not prompted by any news releases. Similarly, the continuation of bearish sell-off right now coincide with the overall bullish "risk-on" sentiment that has permeated the Asian session which has spilled over to European bourses as well.
Hourly Chart XAU/USD Hourly" title="XAU/USD Hourly" width="651" height="614">
Certainly this may leave a bad taste to some purist that demands to know the reason for every ebb and flow of price movement. In this regard, the only plausible explanation for the rally would be financial institutions buying up Gold during the time period. Why are they doing this? The reason isn't entirely clear right now but we've definitely spotted large institutions buying up Gold without specific reasons in the past. The only issue is that we do not have any evidence that this is indeed happening - not now at least. Luckily for us, COT numbers will be able to reflect this as the data is taken every Tuesday. If we see Friday's COT numbers reflecting increasing speculative long positions, the hypothesis will stand.
From a technical perspective, it is no surprise that the sharpest of current bearish momentum came after 1,255 resistance was tested and held, while current leg of bearish momentum similarly came after 1,245 soft support turned resistance held. Right now, prices appears to be pulling back slightly with Stochastic readings pointing slightly higher within the Oversold region. Hence, a test of 1,242 soft support turned resistance is possible, and price may still push up to 1,245 in the near term should "risk on" abates. Similarly, if 1,242 holds, price may continue its decline to 1,237 and subsequently 1,232 soft support.
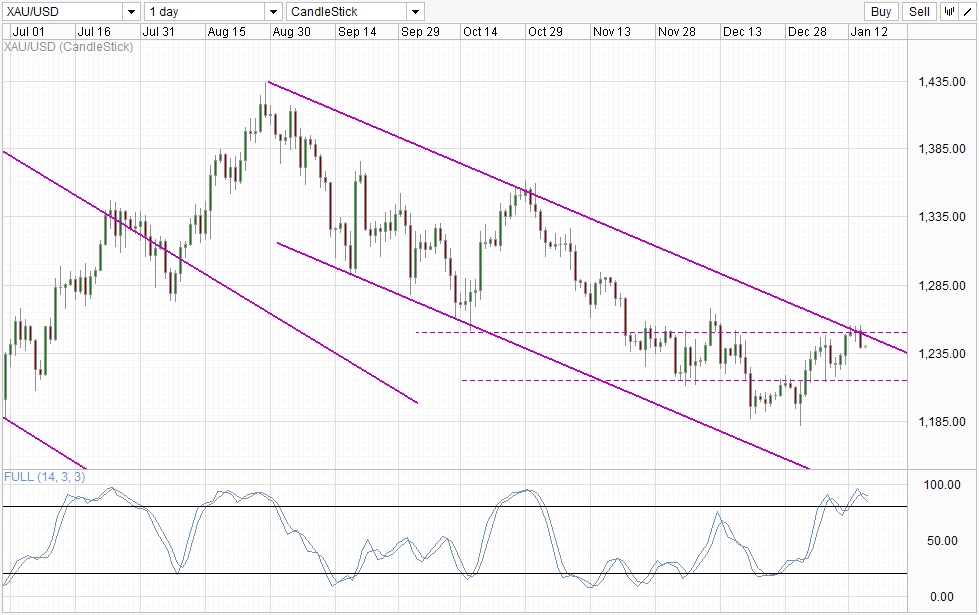
Daily Chart XAU/USD Daily" title="XAU/USD Daily" width="651" height="614">
Daily Chart is much more bearish, as prices have successfully rebounded off Channel Top and has traded back into the 1,215 - 1,250 consolidation range. Stochastic readings agree with this bearish outlook with Stoch curve forming a top. If price manages to breach 1,215 in conjunction with Stoch curve pushing below the "support" of 75.0, bearish acceleration may take place which can bring us to Channel Bottom quickly with 1,185 - 1,215 providing interim support
Original post
- English (UK)
- English (India)
- English (Canada)
- English (Australia)
- English (South Africa)
- English (Philippines)
- English (Nigeria)
- Deutsch
- Español (España)
- Español (México)
- Français
- Italiano
- Nederlands
- Português (Portugal)
- Polski
- Português (Brasil)
- Русский
- Türkçe
- العربية
- Ελληνικά
- Svenska
- Suomi
- עברית
- 日本語
- 한국어
- 简体中文
- 繁體中文
- Bahasa Indonesia
- Bahasa Melayu
- ไทย
- Tiếng Việt
- हिंदी
Gold: Lower But Not Due To Taper Fears
ByMarketPulse
AuthorMingze Wu
Published 01/15/2014, 06:34 AM
Updated 03/05/2019, 07:15 AM
Gold: Lower But Not Due To Taper Fears
Latest comments
Loading next article…
Install Our App
Risk Disclosure: Trading in financial instruments and/or cryptocurrencies involves high risks including the risk of losing some, or all, of your investment amount, and may not be suitable for all investors. Prices of cryptocurrencies are extremely volatile and may be affected by external factors such as financial, regulatory or political events. Trading on margin increases the financial risks.
Before deciding to trade in financial instrument or cryptocurrencies you should be fully informed of the risks and costs associated with trading the financial markets, carefully consider your investment objectives, level of experience, and risk appetite, and seek professional advice where needed.
Fusion Media would like to remind you that the data contained in this website is not necessarily real-time nor accurate. The data and prices on the website are not necessarily provided by any market or exchange, but may be provided by market makers, and so prices may not be accurate and may differ from the actual price at any given market, meaning prices are indicative and not appropriate for trading purposes. Fusion Media and any provider of the data contained in this website will not accept liability for any loss or damage as a result of your trading, or your reliance on the information contained within this website.
It is prohibited to use, store, reproduce, display, modify, transmit or distribute the data contained in this website without the explicit prior written permission of Fusion Media and/or the data provider. All intellectual property rights are reserved by the providers and/or the exchange providing the data contained in this website.
Fusion Media may be compensated by the advertisers that appear on the website, based on your interaction with the advertisements or advertisers.
© 2007-2025 - Fusion Media Limited. All Rights Reserved.
