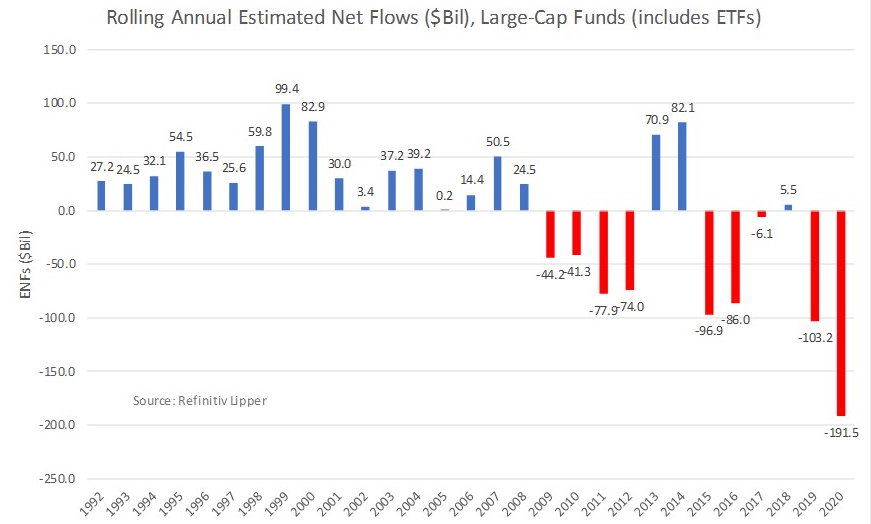
Since the COVID-related market meltdown in March, equity funds (including ETFs) have continued to suffer net outflows despite the average equity fund moving into positive territory and posting a year-to-date return of 2.93%. They have handed back some $317.0 billion year to date (their largest net outflows for any full one-year period) through the Refinitiv Lipper fund-flows week ended October 21, 2020.
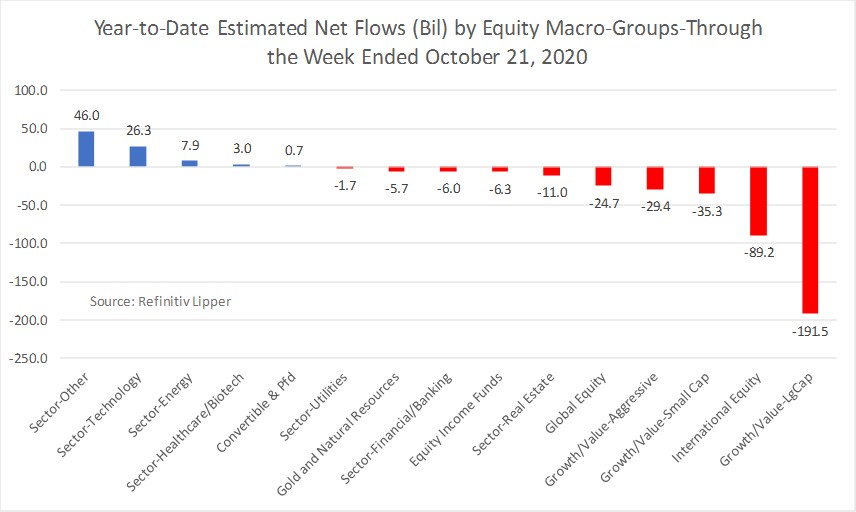
As we have highlighted in prior segments, U.S. domiciled large-cap funds (-$191.5 billion)—the flows pariah of the equity universe—have continued to suffer secular net outflows, bettered by international equity funds (-$89.2 billion) and small-cap funds (-$35.3 billion).

However, year to date, three fund macro-groups have been the primary attractors of investors’ assets in the equity universe.
Sector other funds (+$46.0 billion), comprised primarily of commodities funds, has taken in the largest draws so far, with Commodities Precious Metals Funds (+$38.7 billion) taking in the lion’s share for this group. SPDR Gold (GLD (NYSE:GLD)) and iShares Gold Trust (NYSE:IAU) attracted the largest draw of net new money year to date, taking in $21.3 billion and $9.5 billion, respectively. The average Commodities Precious Metals Fund is up 23.57% year to date.
With the rise in FAANG stocks becoming a mainstay in headline news in 2020, it’s not too surprising to see sector technology funds taking in the next largest amount of net new money in the equity universe year to date, attracting some $26.3 billion. The three-top attractors of investors’ assets year to date for this group were Ark Innovation ETF (ARKK), +$5.1 billion), Vanguard Information Technology Index ETF (VGT), +$3.4 billion), and First Trust Cloud Computing ETF (SKYY, +$1.6 billion), with Blackrovk Technology Opportunities Fund, Institutional Share Class (BGSIX, +$1.4 billion) taking in the next largest sum.

The last group of primary attractors of investors’ assets so far in 2020 has benefitted from investors’ interest in energy, including those funds focused on alternative energy and green-related initiatives of late. The sector energy (+$7.9 billion) macro-group is made up of Commodities Energy Funds, Energy MLP Funds, Alternative Energy Funds (this classification is a new entrant in the Lipper equity universe and was launched in August 2020), Natural Resources Funds, and Global Natural Resources Funds.
While Energy MLP Funds have taken it on the chin in 2020, posting a 33.92% market decline year to date and handing back $5.6 billion in net outflows so far, Commodities Energy Funds (+$4.5 billion, but also posting negative returns of 38.53%) and Alternative Energy Funds (+$1.8 and chalking up a handsome 35.35% year-to-date return) have been attractors of investor assets so far this year. Alternative Energy Funds (+24.67%) posted the strongest quarterly return in Q3 2020.
While Natural Resources funds/ETFs attracted the four largest individual sums of net new money year to date, iShares Global Clean Energy ETF (ICLN, +$1.0 billion), Invesco Solar ETF (TAN, +$712 million), and Invesco WilderHill Clean Energy ETF (NYSE:XLE) (PBW, +$417 million)—all warehoused in the newly created Alternative Energy Funds classification—took in the next largest net inflows of the macro-group so far for 2020.
