The incipient sensations of aeronautical lift oft give one a bit of a rush -- some 180° out-of-phase from that of a descending roller coaster wherein you are lifted from your seat -- in the rapid ascent of flight the cushion pushes itself up into you as both thrust and wings haul you high into the sky.
We felt a similar moment of rush come Thursday afternoon, basking in the afterglow of Gold's both having confirmed closing above that dastardly downtrend line as herein presented a week ago, as well as finally flipping its parabolic trend on the weekly bars from Short to Long.
Let's begin with a side-by-side three-month graphic of Gold and the S&P along with their respective valuation tracks, (the smooth pearly lines regressing each market's movements to those of the BEGOS components: Bond/Euro/Gold/Oil/S&P). Because prices move more swiftly than do the smooth lines, from a trader's perspective, price's penetration of value is the direction in which to be positioned. 'Tis the same strategy at a more rudimentary level when simply drawing a straight line with a pencil and ruler on a chart and then seeing price move through that line. As is the case on the left for Gold, the purple line at which we looked last week and of which extends back for more than a year, now shows price having ascended up through it. As is the case on the right for the S&P, in comparative context, you can see why we remain on "crash watch":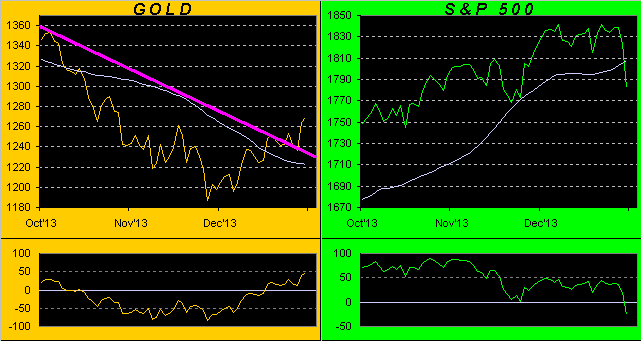
Gold is making what I expect will be in hindsight a material swing to the upside. You can sense it, feel it, indeed see it in these recent weeks via the improving signs that we've been graphically presenting: the rising support levels in Gold's trading profile, the rising of the "Baby Blues" ahead of the 21-day linear regression trend pivoting from down to up and gaining consistency, the upside break above the descending purple trendline just shown, et alia. And as noted, Thursday also heralded for Gold's weekly bars the reversing of the parabolic trend from Short to Long per the blue dot at the lower right: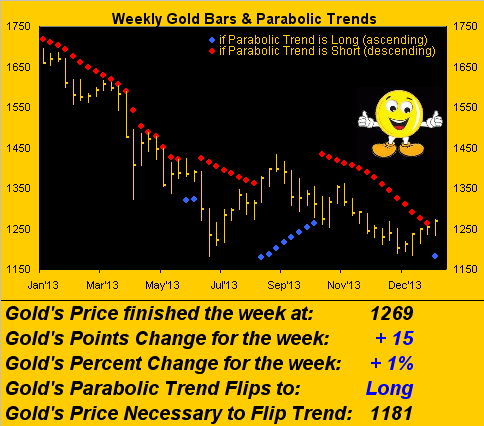
That's five consecutive up weeks for Gold, again with its settle practically on the high. Naturally, (per the state of the Gold Stack at the foot of this missive), there are a cavalcade of overhead obstacles from which Gold shall repel over the broad term; but the notion here is a turn of the net churn from negative to positive. I recall sharing with you that during my being a bystander at holiday get-togethers, I heard folks bringing up the issue of Dollar debasement, and for the first time in casual gatherings, concern about the Fed's over-accommodating, yet having to so do, and thus the implications that Gold may actually stop going down.
Moreover, I liked Peter Schiff's line this past week: "Gold has already priced in whatever taper is coming ... [and with respect to the Fed] ... they have to keep printing money. They can't stop." Spot on, that. Indeed the more perceptive analysts out there are increasing their focus on Gold. In response to some observances by our good colleague Bruce Weinstein over at Goldeneye Investment Strategies, I wrote on Tuesday as follows: "...Tis very important that you and other focused analysts are getting that 'sense' that the tide for Gold is turning positive. To be sure, we may be early, but the more this 'sense' builds, the more the similar sentiment works its way into the investing fabric, ultimately resulting in higher prices..." Onward and upwards.
So 'twas an important swing week technically for Gold, albeit when we look across the 10-year landscape incorporating the 300-day moving average, whilst near-term we feel like we're flying, more broadly we need keep our feet on the ground as to how substantive the current up turn may, or may not yet, become...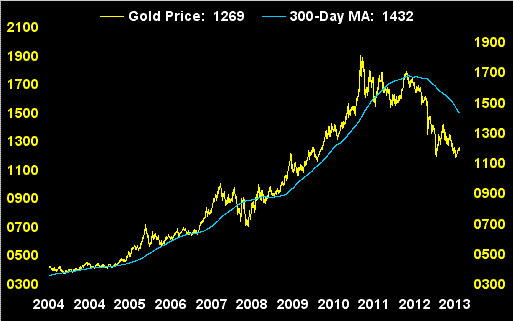
...but Gold shall turn materially higher from some point toward the northerly climes of the above chart and beyond. To quote the great Inspecteur Clouseau: "There is a time and place for everything ... and this is it!" (Clearly, when it came to timing, he had issues). Nevertheless as mentioned in kicking off 2014, were Gold to regain at least the bottom of The Floor (1466-1579) by mid-year would be both a welcome and terrific achievement. And where would a price of 1466 then be vis-à-vis the 300-day moving average?
"Back above it, mmb."
Exactly right my friend. (Over the years, Squire's ever-improving perception of arithmetic disposition has proved nothing short of remarkable).
But back to Thursday for a final time. Whilst gazing at Gold's having trumped both the descending purple trendline and declining parabolic red dots, it occurred to me that this newfound energy would foster calls from the "en route to zero" crowd, the recent rally only being an abberative fade, a false spate of euphoria, a fake-out breakout, a fat-fingered faux pas. Well, it didn't take long.
Enter Claire Voyante: not two hours into the satisfaction of Gold's technical turnabout -- and expectant of the counter-culture clashers eventual emergence -- into my inbox was forwarded a piece written by a prominent brokerage's analyst, fresh off the wires of arguably the world's greatest financial media company, stating that this is (in the analyst's words) "a chance to dump Gold on the upturn", the justification for which I found lemming-like and weak. But it reminds us once again of life's four certainties: the nattering Gold-Negative Nabobs necessary to take the other side of the trade, the ineradicable Gold Gopher that is systematically re-arranging our front lawn, Death, and the worst of the bunch, Taxes.
Then of course, there's the Tracks: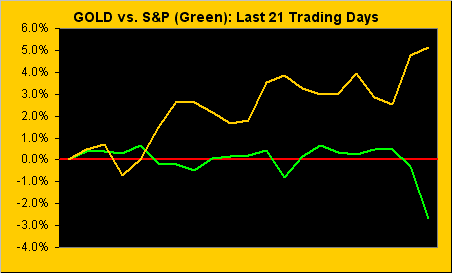
Where doth the dough flow? Rather telling, that! However: from the precious metals enthusiast's stance, problematic with a plunging S&P is the extent to which Sister Silver can suffer in consequence, for she is partially industrial metal. Thus when the purely industrial red metal Dr. Copper is under woe, taking the S&P down in tow, the white metal's precious metal correlation with Gold oft loses full glow. To wit, this next chart is the same as that above, save for replacing the S&P with both Silver and La Rouge: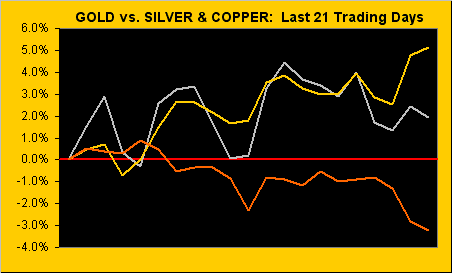
Fortunately, over the broadest of moves, Silver's directional price tendency is to cling more to Gold than it does to Copper. So hang onto those Morgans!
On to the aforementioned climb of Gold's baby blue dots which measure the ~consistency~ of 21-day linear regression trend. At left their now having achieved the +80% level confirms such uptrend as in place. (From a year ago-to-date, Gold's Baby Blues have at best resided above the +80% level for just six consecutive days; so far on this run we've four and are looking for more). At right for the same study across the S&P's last 21 days, well...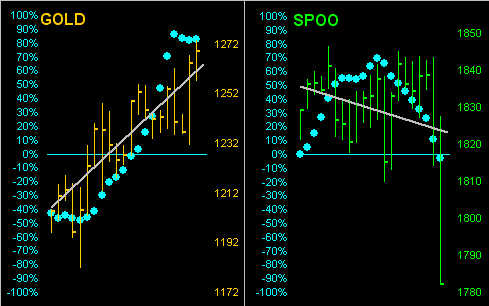
...and the S&P's Baby Blues have only just crossed below their horizontal axis. On "crash watch" indeed, notwithstanding a "dead cat bounce" in the midst. In yesterday's (Friday's) pre-opening "Prescient Commentary", we cited the S&P's recent selling as "meager". And whilst its trading session turned into the worst one on both a points and percentage basis since 20 June of last year, I'll stand by the notion that the overall selling from the S&P's record level of 1850 just a week ago remains meager given our quip that "change is an illusion whereas price is the truth". Here at S&P 1790, we're still in the thermosphere; as would we now be in the 1600s and 1500s, for again, the real earnings aren't there. Oh yes, if you've been tracking Q4 Earnings Season over at the website, you've seen with some 252 corporate reports in the books (of what will total 2,000+ by season's end) that 66% have bettered their year-over-year quarterly earnings growth: that is the best such percentage reading for that category since Q2 of 2006. The problem is that the actual earnings levels remain too low to support the high levels of price. And perhaps now word of such is finally (understatement) getting out (pun!).
For just as the S&P's moneyflow led the Index higher and higher, so is there now the transition of leading it lower: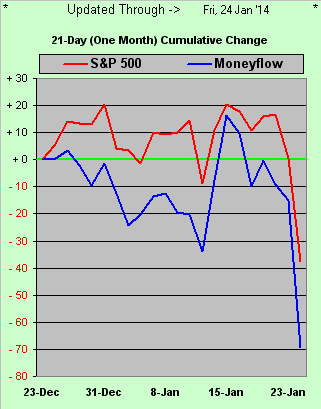
Remember: the most oft-used, worn-out reason we've heard ad nausea for the S&P's incessant rising in the face of little real earnings growth is that "there is nowhere else to put your money".
Query: given the warped price/earnings imbalance (conservatively 25.5x to 62.2x if honestly calculated), what shall befall the stock market when "there is somewhere else to put your money", (i.e. Gold)?
Upon further review: if the economy truly is taking a turn for the worse -- for example per rampant retail layoffs in the 1,000s by Macy's, Penny's and Sammy's -- the current paradigm of market illogic ought have it on the rise, non? Or is "bad news = more Fed follies = higher stock prices" not going to work anymore... Let's see what comes of Ms. Yellen's chairing her first FOMC Policy meeting this week.
Purportedly, the EuroZone is going merrily along, but then we've this headline amongst many contextually similar which flashed across the screen last week: "Dow pummeled: Earnings, global economic fears thrash markets" On top of which China is now expected to contract? Oh the moaning: "Where's the Fed when we need 'em? Now all my S&P gains since mid-December are gone and that trip I booked to Bora Bora is non-refundable!" How quickly the taste of treasure turns tart...
A 25% correction from the S&P's high would put the Index at 1388. What about your gains since then? (And who is it that puts forth on occasion about "sittin' on the bid at 880?" That'd be a 52% correction, but 'twould put the p/e around 10x, which as we were taught in B-school is an "acceptable" valuation ... just in case you're scoring at home).
Next we've the trading profiles for both Gold and the S&P, the coloured swaths representing the most recent trading session ranges: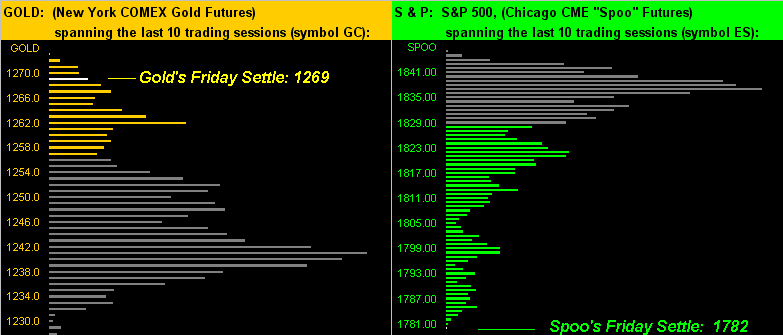
Stark in those above profiles are both Gold's support apices and the those of resistance for the S&P. Were they to respectively contain price in both cases, Gold's low for the entire year and the S&P's high for same may well already be in place.
Two quick notes and then we'll close it out with the Stack:
1) From yesterday's newsfeed: "Credit Suisse ... the second-largest Swiss bank, is paying part of 2013 bonuses to top employees in bonds that can be wiped out if the firm fails to maintain enough capital." That's cute. I've "family" in their Zürich office, (and you know who you are out there). Redeem 'em for Gold while you've the chance!
2) Best wishes to one of the brightest bulbs on the planet, Mohamed El-Erian as he exits PIMCO. Perhaps even he's been befuddled by what ought be happening hasn't.
Here's the Gold Stack:
Gold’s All-Time High: 1923 (06 September 2011)
The Gateway to 2000: 1900+
The Final Frontier: 1800-1900
The Northern Front: 1750-1800
On Maneuvers: 1579-1750
The Floor: 1466-1579
Le Sous-sol: Sub-1466
The 300-day Moving Average: 1432
Base Camp:1377
Structural Resistance: 1322 / 1381 / 1479 / 1524-1535
Trading Resistance: (none)
Year-to-Date High: 1273
Gold Currently: 1269, (weighted-average trading range per day: 18 points)
Trading Support: 1262 / 1252 / 1248 / 1241
Structural Support: 1249 / 1227 / 1163 / 1145
10-Session “volume-weighted” average price magnet: 1248, (directional range: 1227 up to 1273 = 46 points or +4%)
Year-to-Date Low: 1203
The Weekly Parabolic Price to flip Short: 1181
- English (UK)
- English (India)
- English (Canada)
- English (Australia)
- English (South Africa)
- English (Philippines)
- English (Nigeria)
- Deutsch
- Español (España)
- Español (México)
- Français
- Italiano
- Nederlands
- Polski
- Português (Portugal)
- Português (Brasil)
- Русский
- Türkçe
- العربية
- Ελληνικά
- Svenska
- Suomi
- עברית
- 日本語
- 한국어
- 简体中文
- 繁體中文
- Bahasa Indonesia
- Bahasa Melayu
- ไทย
- Tiếng Việt
- हिंदी
Gold Takes Off, Climbs Above Trend
Latest comments
Loading next article…
Install Our App
Risk Disclosure: Trading in financial instruments and/or cryptocurrencies involves high risks including the risk of losing some, or all, of your investment amount, and may not be suitable for all investors. Prices of cryptocurrencies are extremely volatile and may be affected by external factors such as financial, regulatory or political events. Trading on margin increases the financial risks.
Before deciding to trade in financial instrument or cryptocurrencies you should be fully informed of the risks and costs associated with trading the financial markets, carefully consider your investment objectives, level of experience, and risk appetite, and seek professional advice where needed.
Fusion Media would like to remind you that the data contained in this website is not necessarily real-time nor accurate. The data and prices on the website are not necessarily provided by any market or exchange, but may be provided by market makers, and so prices may not be accurate and may differ from the actual price at any given market, meaning prices are indicative and not appropriate for trading purposes. Fusion Media and any provider of the data contained in this website will not accept liability for any loss or damage as a result of your trading, or your reliance on the information contained within this website.
It is prohibited to use, store, reproduce, display, modify, transmit or distribute the data contained in this website without the explicit prior written permission of Fusion Media and/or the data provider. All intellectual property rights are reserved by the providers and/or the exchange providing the data contained in this website.
Fusion Media may be compensated by the advertisers that appear on the website, based on your interaction with the advertisements or advertisers.
© 2007-2025 - Fusion Media Limited. All Rights Reserved.