It doesn’t take much downside price action to make gold investors nervous, or much upside price action to make greed appear.
It’s probably true that no fever is like gold fever!
To reduce these swings in emotion, my suggestion is for investors to do most of their buying and selling at major support and resistance zones.
For all practical intents and wealth building purposes in the gold market, the price action outside of these buy and sell zones is mostly “noise”.
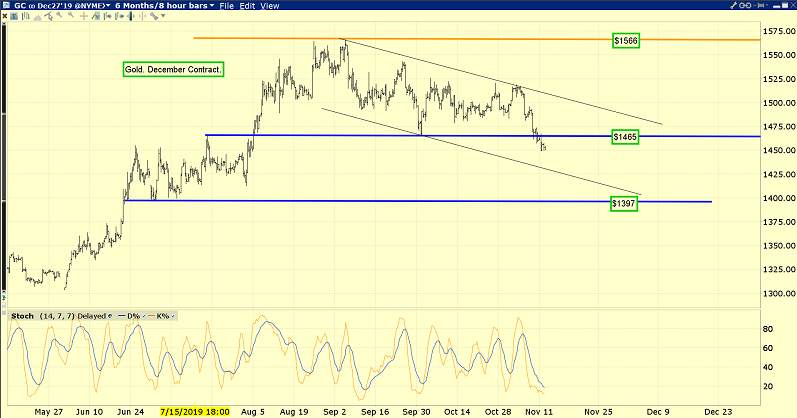
Since reaching the $1566 area, gold has drifted down to the $1465 support zone.
My tactics for a gold price reaction are basically to nibble lightly when gold arrives at the first support zone, and to place “meatier” buys at the next one.
So, the $1465 area is for “nibblers” and the $1397 support zone is for more serious buying. The $1397 area is also for investors who like to “back up the truck”.
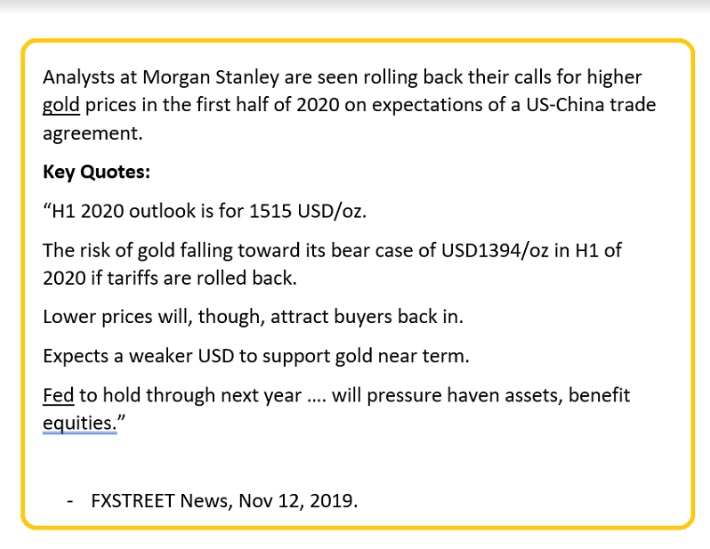
Some major bank analysts are focused on this zone. Morgan Stanley (NYSE:MS) is potentially looking at the $1394 area in 2020 H1, although their base case is for $1515.
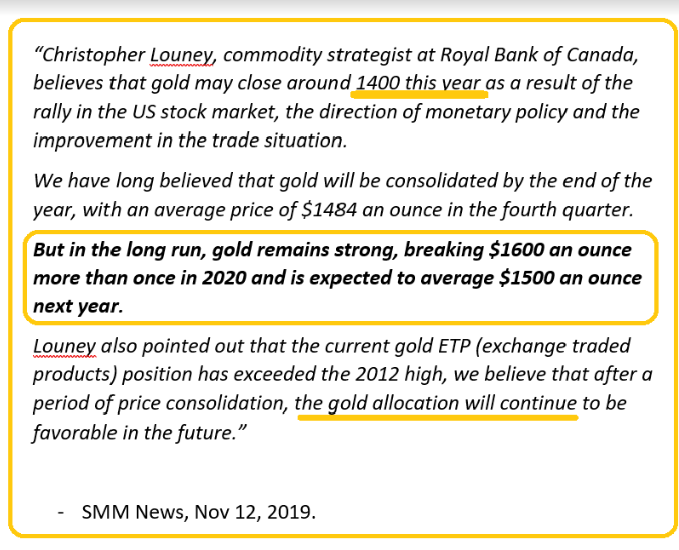
Royal Bank’s Chris Louney sees gold at $1400 over the next couple of months, followed by a major rally into the $1600 area.
The entire $1400-$1350 area can be viewed as a giant support zone.
It’s unknown if the price of gold will go there, but major banks will be substantial buyers if it does.
Gold bugs who are interested in getting richer will need to be ready to buy there too!
USD/JPY
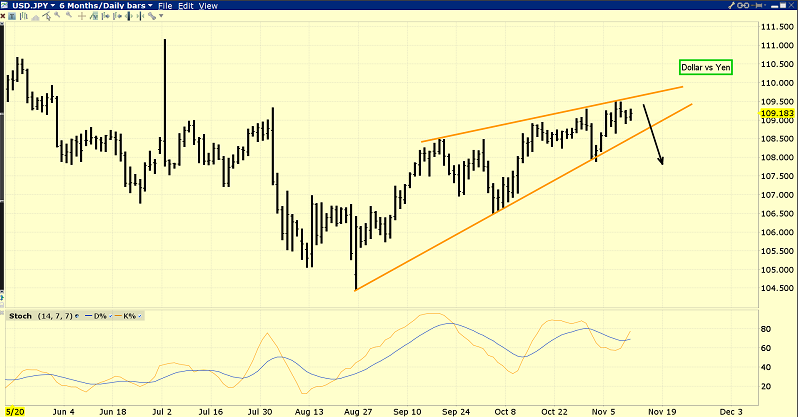
The dollar’s action against the yen is much more important for gold investors than the USD action, and right now there’s an ominous rising wedge in play for the dollar.
If the dollar breaks down from the wedge pattern, that would be a very positive event for gold.
Trump seems eager not to impose more tariff taxes, but he seems less eager to roll back all the ones he has in place now.
The big bank analysts appear to be basing their $1400 gold price scenarios on an actual rollback of the tariffs, not just a lock of the existing ones or a few token cuts.
If that doesn’t happen, the dollar likely tumbles against the yen, stock markets react negatively, and gold begins a fresh rally towards the $1566 highs!
Dow Jones Industrial Average
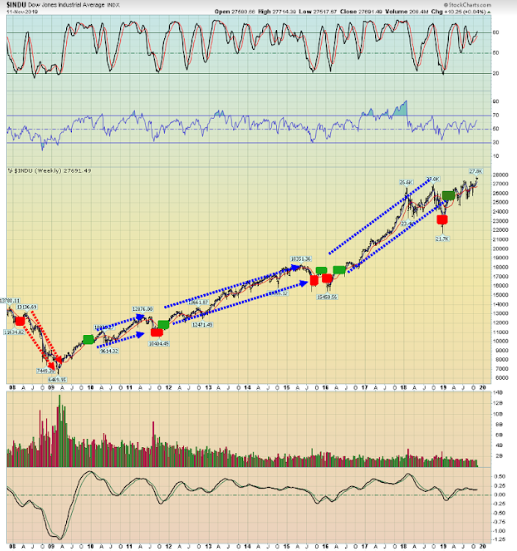
To manage the risk of a real trade deal that rolls back tariffs and pushes gold down to the $1400-$1350 support zone, investors can follow my long-term US stock market signals.
Another approach is to use my guswinger.com hourly chart swing trade signals for NUGT/DUST and for leveraged stock market ETFs. We are long the TQQQ ETF now. Swing trading allows investors to stay active and book wins, regardless of whether the market is trending up or down.
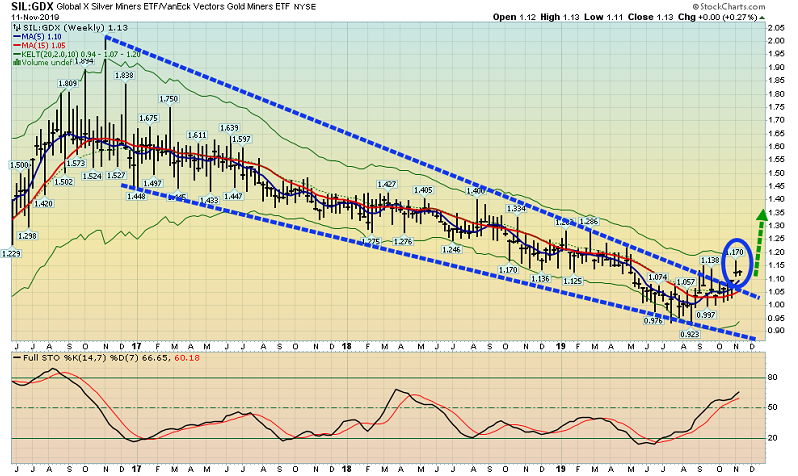
Silver bullion staged an upside breakout against gold recently, but it gave back most of the gains
In contrast, silver stocks are now breaking out against gold stocks, as seen on this SIL versus GDX chart. I cover some of the hottest ones in my gracelandjuniors.com newsletter.
There’s growing pressure to close the “wealth gap”. US wage growth is bumping against the 4% marker now. A breakout above that level should send silver stocks soaring higher!
Thanks!
Written between 4am-7am. 5-6 issues per week. Emailed at aprox 9am daily.
Stewart Thomson is a retired Merrill Lynch broker. Stewart writes the Graceland Updates daily between 4am-7am. They are sent out around 8am-9am. The newsletter is attractively priced and the format is a unique numbered point form. Giving clarity of each point and saving valuable reading time.
