I have to admit, I never saw gold stocks correcting this much. After making a textbook double bottom and registering very strong momentum readings, I expected a relatively tame October correction to be followed by another leg higher into year end. I thought GDX would bottom at $49. Obviously I was wrong on all counts. It’s difficult to make predictions when they are about the future. Kidding aside, forecasts are only a guide or a potential roadmap. No one can predict the future. However, we can assess risk, reward and probabilities. We think the probabilities favor a secondary bottom in the gold stocks and very soon the risk/reward dynamic will be heavily in favor of longs.
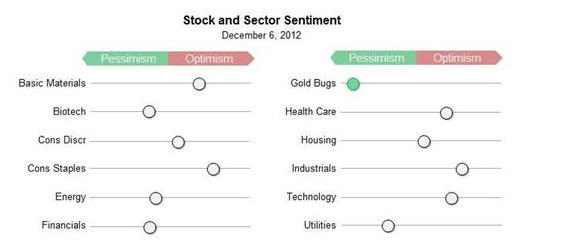
Posted is a chart from sentimentrader.com. Their sector sentiment indicator is a combination of short interest and put-call ratios. It can’t get much worse for the gold stocks. (Well, perhaps just a bit).
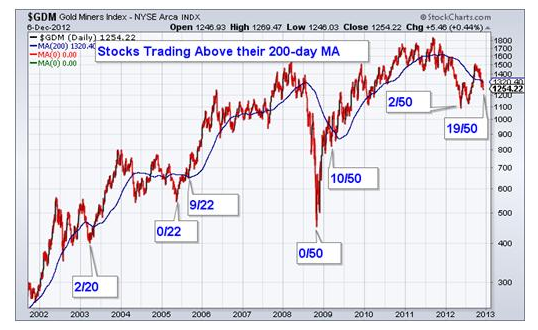
Next, we want to look at the breadth of the gold stocks. Breadth is a measurement of participation. I wanted to look at a large group of stocks and measure their breadth at major bottoms and at secondary bottoms. For simplicity, I looked at the number of stocks trading above their 200-day moving average. The results are in the chart.
I wanted to compare the current breadth to the breadth seen at the secondary bottoms in 2005 and 2009. Note that at the major lows, breadth is usually at or near zero. At the secondary low in 2005, breadth was 41%. The market was in a stronger technical position then as the cyclical bear market was tame. In 2009, the breadth at the secondary low was 20%. Go back to 2002-2003 and you’ll notice a triple bottom. Unlike the present there was no major technical damage. At the third and final bottom breadth was 10%. Presently, breadth is at 38%. It can fall to 20% and that would be in line with the most recent secondary bottom (following a major bottom). The conclusion is that following a major bottom long-term breadth should remain healthy. It still is.
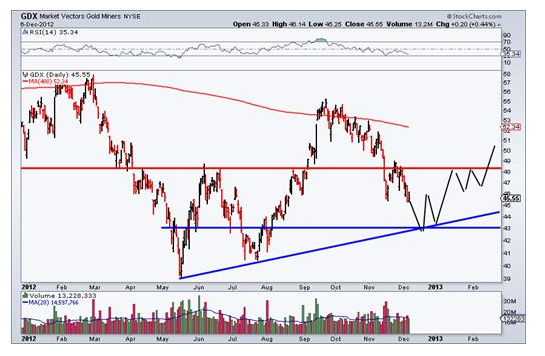
Moving from the complicated to the simple, here is one thought as to how this secondary bottom could play out. We are watching $43 as it is both lateral and trendline support.
Less than three weeks ago we wrote:
If we are indeed correct that the metals and shares will remain range bound then your task is simple. Prepare yourself for further consolidation by having your buy list ready and then be ready to act when the time comes. A wise friend once told me that in a bull market the goal is to accumulate positions at the lowest prices possible.
It is always easy to say buy later or buy on a correction. How often do we hear that? Rick Rule says that when investing in the resource sector you are either a contrarian or a victim. Consider the present sentiment and technical construct and it is difficult to ignore this emerging contrarian opportunity. Oh and by the way, the Fed is meeting next week. With gold stocks tanking into the meeting, it provides the setup for a bottom and rebound into January. Now is the time to be vigilant as the time to be a contrarian could be only days away.
- English (UK)
- English (India)
- English (Canada)
- English (Australia)
- English (South Africa)
- English (Philippines)
- English (Nigeria)
- Deutsch
- Español (España)
- Español (México)
- Français
- Italiano
- Nederlands
- Português (Portugal)
- Polski
- Português (Brasil)
- Русский
- Türkçe
- العربية
- Ελληνικά
- Svenska
- Suomi
- עברית
- 日本語
- 한국어
- 简体中文
- 繁體中文
- Bahasa Indonesia
- Bahasa Melayu
- ไทย
- Tiếng Việt
- हिंदी
Gold Stocks: Risk-Reward Ratio Favors Longs
Published 12/07/2012, 09:40 AM
Updated 05/14/2017, 06:45 AM
Gold Stocks: Risk-Reward Ratio Favors Longs
Latest comments
Loading next article…
Install Our App
Risk Disclosure: Trading in financial instruments and/or cryptocurrencies involves high risks including the risk of losing some, or all, of your investment amount, and may not be suitable for all investors. Prices of cryptocurrencies are extremely volatile and may be affected by external factors such as financial, regulatory or political events. Trading on margin increases the financial risks.
Before deciding to trade in financial instrument or cryptocurrencies you should be fully informed of the risks and costs associated with trading the financial markets, carefully consider your investment objectives, level of experience, and risk appetite, and seek professional advice where needed.
Fusion Media would like to remind you that the data contained in this website is not necessarily real-time nor accurate. The data and prices on the website are not necessarily provided by any market or exchange, but may be provided by market makers, and so prices may not be accurate and may differ from the actual price at any given market, meaning prices are indicative and not appropriate for trading purposes. Fusion Media and any provider of the data contained in this website will not accept liability for any loss or damage as a result of your trading, or your reliance on the information contained within this website.
It is prohibited to use, store, reproduce, display, modify, transmit or distribute the data contained in this website without the explicit prior written permission of Fusion Media and/or the data provider. All intellectual property rights are reserved by the providers and/or the exchange providing the data contained in this website.
Fusion Media may be compensated by the advertisers that appear on the website, based on your interaction with the advertisements or advertisers.
© 2007-2025 - Fusion Media Limited. All Rights Reserved.
