Gold and related investments are off to a very positive start in 2018. I don’t expect any major pause in the action until China’s Golden Week holiday celebrations get underway.
Chinese gold dealers will be on holiday this year from about February 15 to February 21. This creates a significant vacuum in gold demand. As dealers and Chinese gold markets close, the gold price tends to soften in global markets.
The good news is that gold has a rough general tendency to rally strongly ahead of the Golden Week festival, and that’s happening right now.
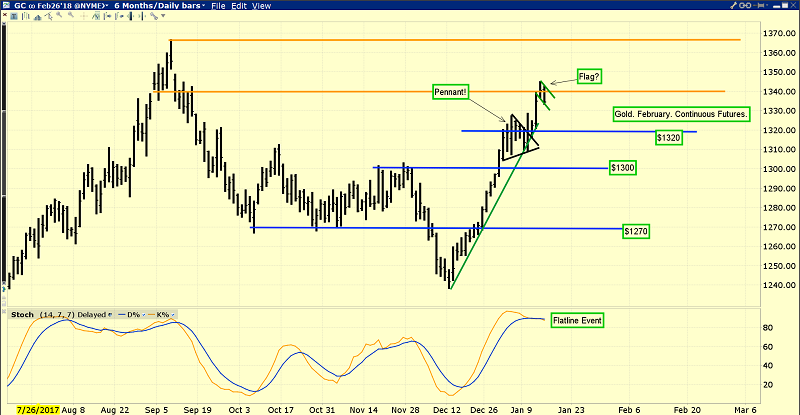
Gold has reached the outer boundary of my $1340 - $1365 resistance zone.
A flag pattern is possibly forming. Note the nice pennant pattern that formed at the $1320 resistance zone area. I would also like investors to note that gold has burst through resistance at both $1300 and $1320 with ease.
Short term technical indicators are overbought and a pullback is expected. Hopefully the pullback is a flag pattern rather than something deeper.
Regardless, both the $1320 and $1300 price zones should now function as support on any pullback.
The $1365 area on this February futures chart is much more formidable resistance, because it represents the highs made when India’s Modi “trumped the Trumpster” by calling in the nation’s fiat money.
Modi did that on US election night, as India’s powerful gold buyers were buying enormous amounts of gold to bet on a Trump victory. Their bets were correct, but Modi ruined the payoff.
That horrific demonetization announcement was followed by “know your client” and GST tax policy announcements. In the short term, these policies were all negative for both gold and GDP growth.
A lot has changed since those policies were unveiled. The Indian gold jewellery market has almost finished restructuring.
Demand for gold in India is now very steady and rising. That trend is not just “here to stay” but here to accelerate!
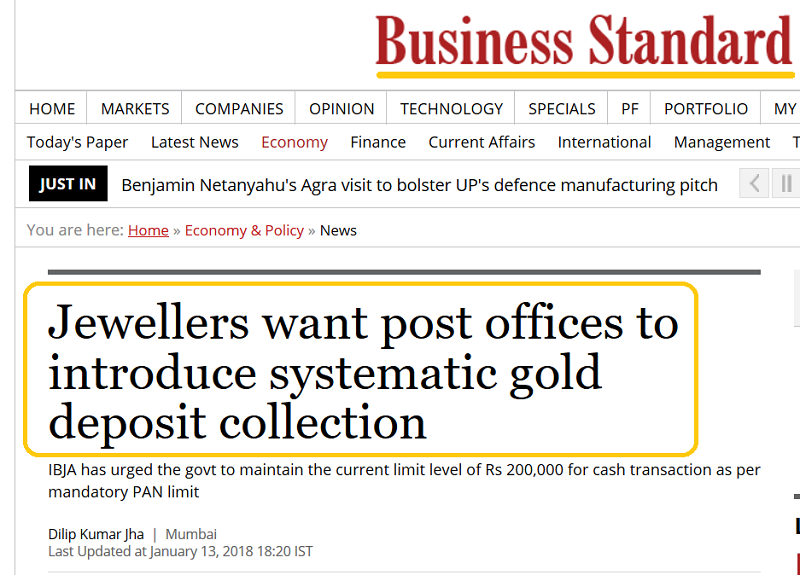
The upcoming Indian Federal budget could feature some positive announcements for gold. The post office plan to help rural Indians buy more gold is just one of many proposals coming from India’s top jewellers. There’s also a chance for a duty cut, which is endorsed by the nation’s commerce department.
In America, Jerome Powell is set to become head of the central bank in just three weeks. His aggressive plans for more quantitative tightening, consistent rate hikes, and deregulation of small banks could be a game changer for the twenty-year bear market in US money velocity.
I’ve predicted he ends that bear market by the summer. That would be a game changer for the equally long bear market in gold stocks versus gold. I believe that bear market ended in 2014-2016, but gold stocks need a major money velocity bull cycle to stage serious outperformance against bullion.
I expect less useless talk from “Fed speakers” in 2018, and more boots on the ground action from Powell with deregulation.
In terms of money velocity, I’ve suggested that gold stocks are probably at a time that can be compared with the 1968 – 1970 period. Inflation is starting to rise, and interest rates are starting to rise. This is exactly what happened from 1968 to 1980, and over the next decade, gold stocks should perform much like they did in the 1970s.
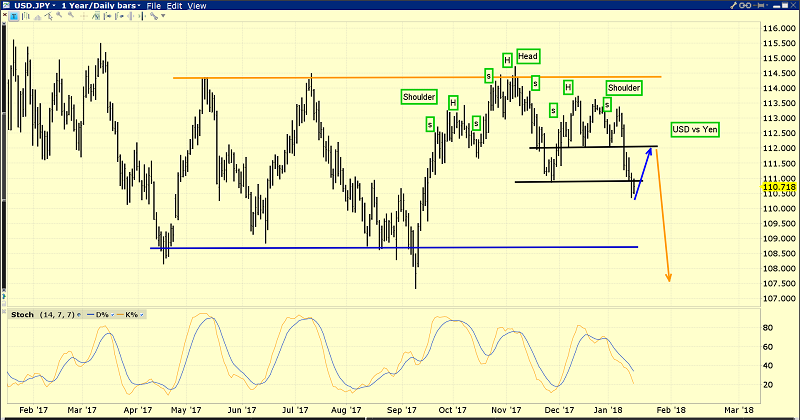
This is the dollar versus yen chart. The dollar broke below another low yesterday. Arguably, it could also be a neckline break on a head and shoulders top pattern.
The bottom line for the dollar: It looks like a train wreck against the yen, the yuan, the rupee, and the euro. A rally is expected now, but it should be modest. That fits with my “possible flag for gold” scenario.
One of Trump’s campaign promises was to lower the dollar against the fiat of other major economies. A bullish bet on the dollar is a bet against the president of the United States. I wouldn’t recommend taking that bet.
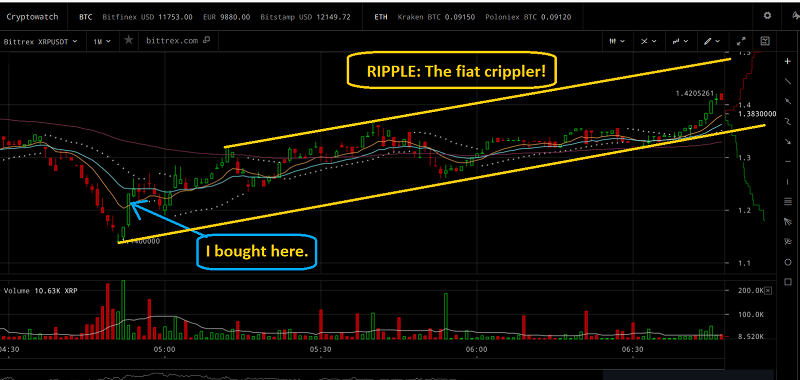
This is the exciting Ripple blockchain currency chart. I tend to approach blockchain investing much like junior gold stocks; I buy a grub stake with 20% - 30% of the total fiat capital I’m willing to commit to the asset, hold 20% to buy at higher prices on pullbacks, and keep 50% to buy at much lower prices.
Right now, I’m a ripple buyer of all 10 cent pullbacks, with a $5 target for the next major move higher.
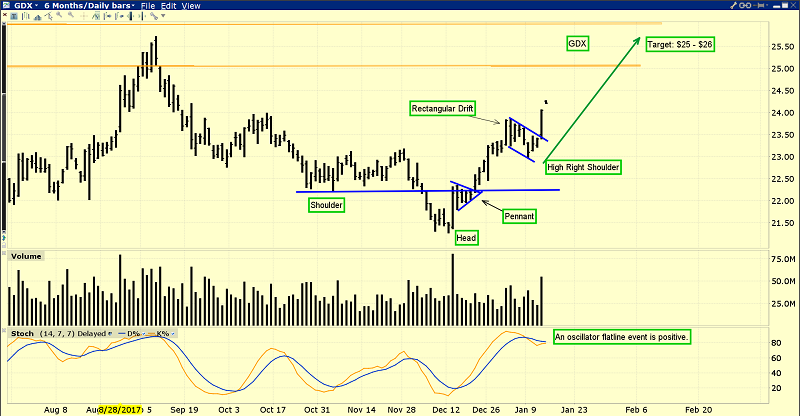
VanEck Vectors Gold Miners (NYSE:GDX) looks like a technical “wonder kid” right now. Note the massive volume on the upside breakout from the rectangular drift pattern that is almost a flag! I expect India to provide the higher price gold floor foundation for a possible surge to the $1500 area for bullion.
In turn, Powell’s deregulation should make GDX look like bullion on steroids, and I expect it could stun most investors by making a new all-time high long before bullion does!
Stewart Thomson is a retired Merrill Lynch broker. Stewart writes the Graceland Updates daily between 4am-7am. They are sent out around 8am-9am. The newsletter is attractively priced and the format is a unique numbered point form. Giving clarity of each point and saving valuable reading time.
Risks, Disclaimers, Legal: Stewart Thomson is no longer an investment advisor. The information provided by Stewart and Graceland Updates is for general information purposes only. Before taking any action on any investment, it is imperative that you consult with multiple properly licensed, experienced and qualified investment advisors and get numerous opinions before taking any action. Your minimum risk on any investment in the world is: 100% loss of all your money. You may be taking or preparing to take leveraged positions in investments and not know it, exposing yourself to unlimited risks. This is highly concerning if you are an investor in any derivatives products. There is an approx $700 trillion OTC Derivatives Iceberg with a tiny portion written off officially. The bottom line:
