Other than during a rally from Thanksgiving until New Year, gold stocks have been under pressure for nearly six months.
The correction itself was not a surprise, but the structure has been different from the corrections during the 2000s.
Those corrections entailed a quick decline and then a recovery of most of the losses, on the way to at least a few more months of consolidation. In 2009-2010, the corrections were especially brief.
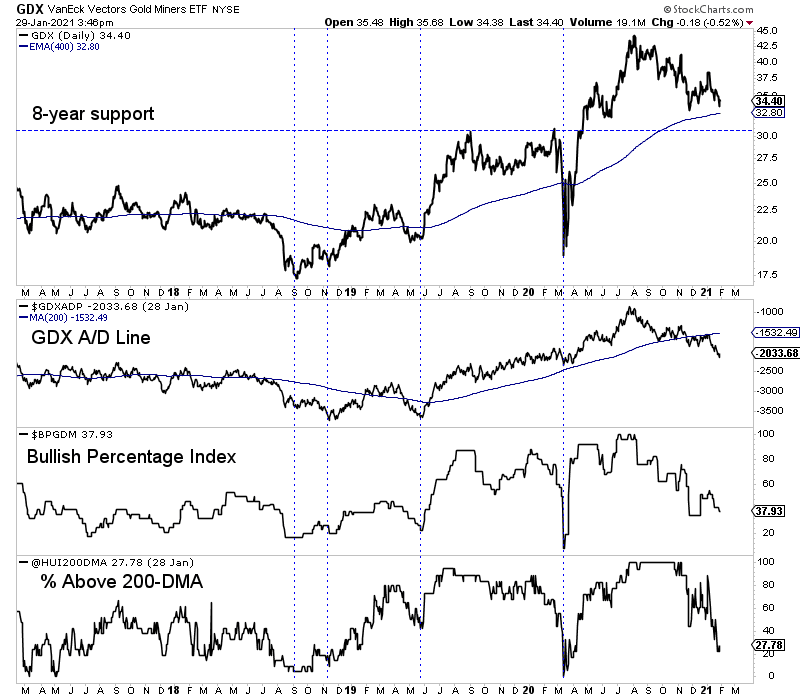
The current correction is nearly six months in, and the gold stocks are fairly oversold and trading just above strong support levels.
VanEck Vectors Gold Miners ETF (NYSE:GDX) has a confluence of support at $32, including the 38% retracement from the 2016 low, the 50% retracement from the COVID low, and the 400-day exponential moving average.
Breadth indicators signal a market that is oversold but could register an extreme should GDX test $32.

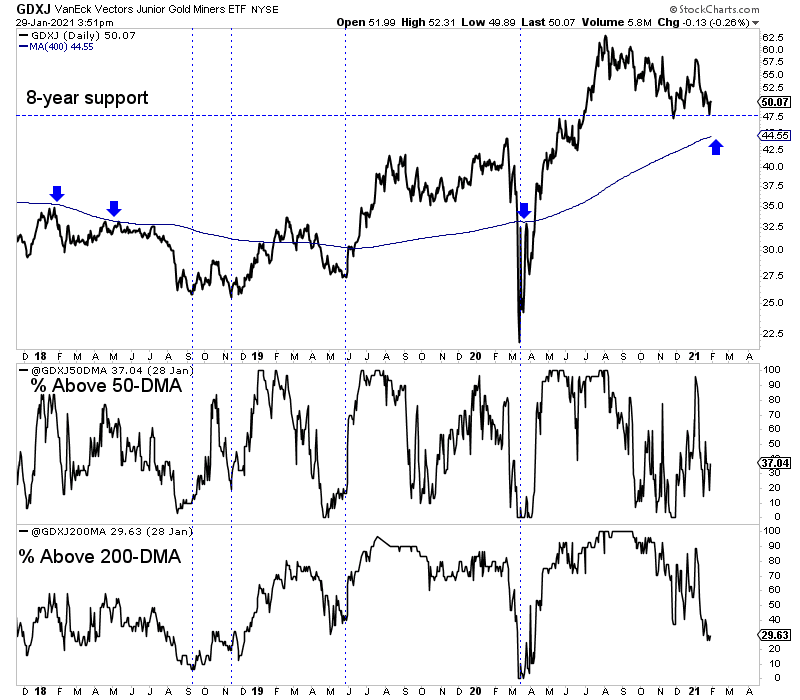
Meanwhile, the prognosis for VanEck Vectors Junior Gold Miners ETF (NYSE:GDXJ) is similar. It has a confluence of support at $47 and $45.
The 8-year support level and 38% retracement from the COVID low are at $47, while the 38% retracement from the 2016 low and 400-day moving average are at $45. Note, the 400-day moving average has been an excellent pivot point over the past decade.
As with GDX, the breadth indicators are oversold but could become more oversold.

The gold stocks could rally from here, but they are missing a few things we like to see around a bottom.
First, there is no positive divergence in the GDX advance-decline line. Second, GDX and GDXJ have not been outperforming Gold.
In addition, while the miners have rebounded a bit in recent days, none of the daily candles signal accumulation.
The miners are oversold and setting up for a rebound, but my guess is they aren’t quite there yet. A $2-$3 decline in GDX and GDXJ would make things easier by bringing them to strong support and likely pushing breadth indicators to oversold extremes.
There is a bit of uncertainty around this bottom but what is much less uncertain is buying high-quality juniors, trading well off their highs, and around excellent entry points.
