The precious-metals sector continues to correct and consolidate. Gold remains in a bullish consolidation. It recently reached resistance again and even though it has failed to breakout, it remains above long-term moving averages, which are sloping upward. However, the gold and silver stocks remain in correction mode. They are trading below the long-term moving averages and at the lower end of their ranges over the past 12 months. That certainly provides an opportunity but these markets may not truly perform until gold is ready to breakout.
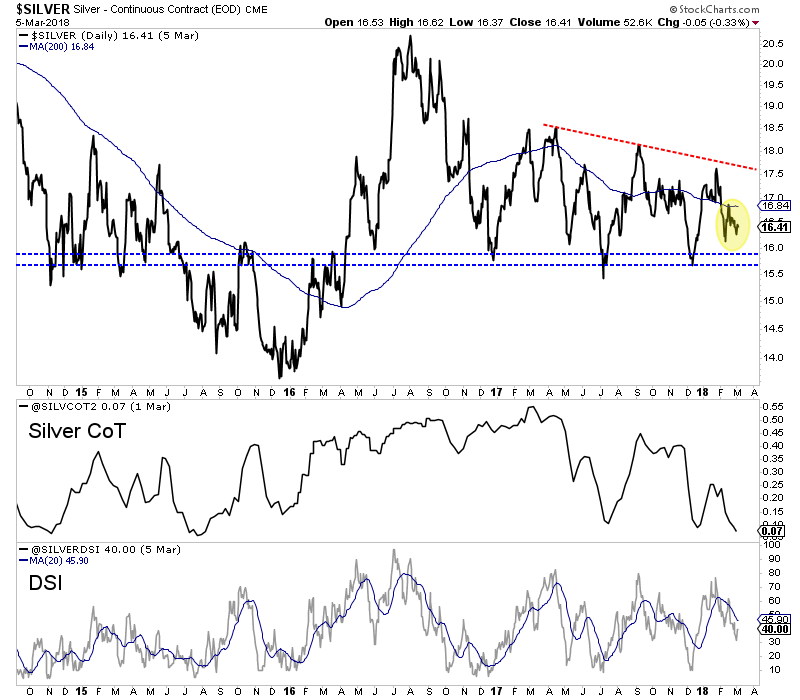
Bullish silver commentaries (because of its CoT) have been making the rounds and I don’t disagree. In the chart below we plot the net speculative position as a percentage of open interest. It is at 7.4%, which is the lowest reading in nearly three years. Interestingly, the daily sentiment index for Silver is not at an extreme. Its at 40% bulls. Technically, silver is wedged in between support and resistance. A break does not appear imminent.
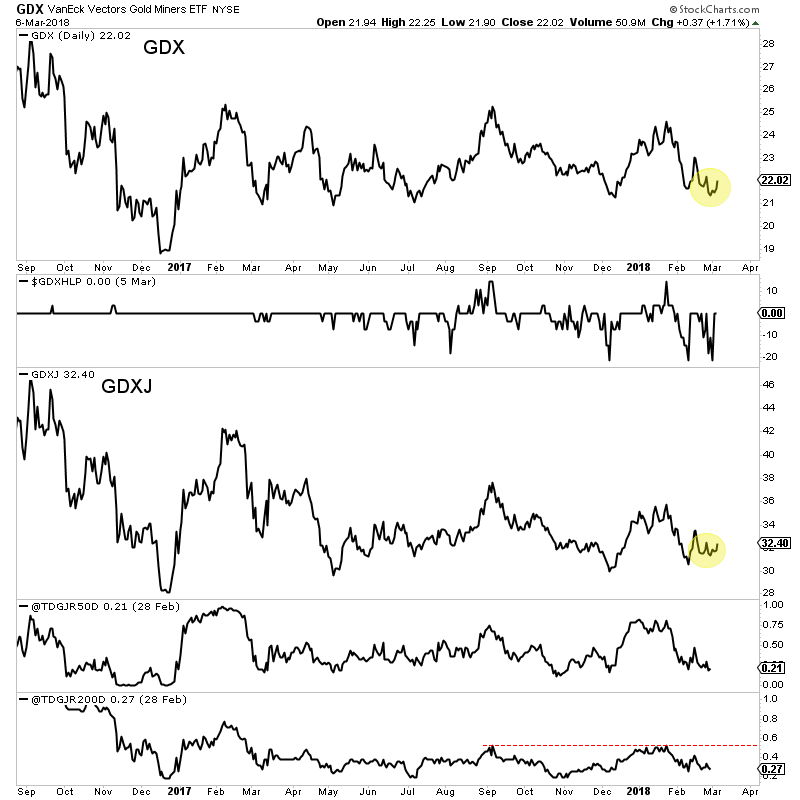
Like silver, the gold stocks are oversold but we do not see an indication of an extreme oversold condition. In the chart below we plot VanEck Vectors Gold Miners (NYSE:GDX) along with the difference between new highs and new lows. We also plot VanEck Vectors Junior Gold Miners (NYSE:GDXJ) along with the percentage of stocks (from a group of 50 we follow) that are trading above the 50-dma and 200-dma. GDX recently held above $21 again (even with over 20% of the index making new 52-week lows) while GDXJ is starting to show a bit more strength relative to GDX. At the low last Wednesday, 19% of those 50 juniors were trading above the 50-dma while 27% were trading above the 200-dma.
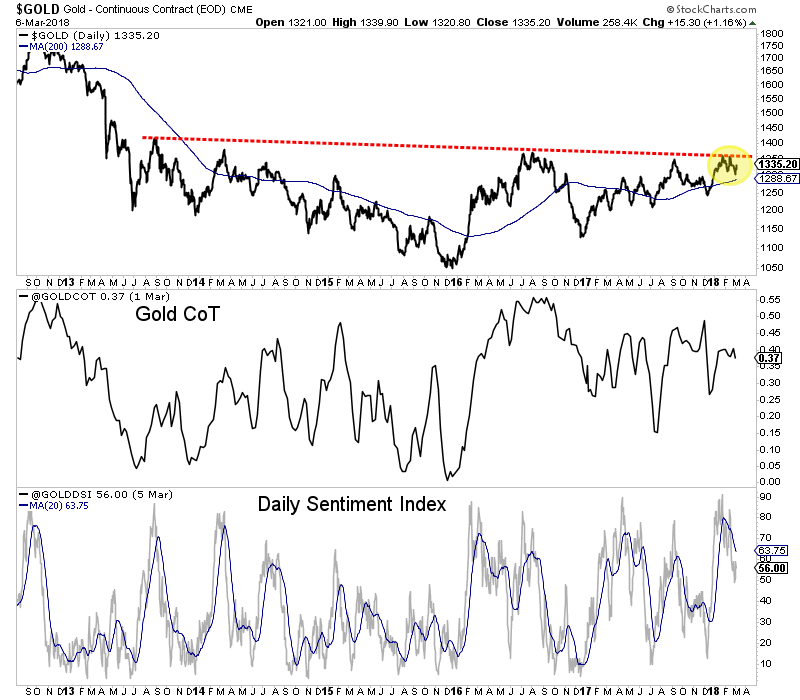
Gold, unlike silver and the gold stocks, has not corrected much and remains much closer to resistance than support. Also, sentiment in gold is much more optimistic than in silver. The net speculative position in gold is 37%, which dwarfs the 7.4% reading in silver. Gold’s daily sentiment index is 56% bulls which is comfortably above silver’s. During bull markets, corrections in gold tend to push the net speculative position below 30%. Gold continues to maintain support at $1300 but we wonder if it needs to break that level and flush out some speculators before breaking out of its larger consolidation.
The precious-metals sector is at an interesting juncture and it remains to be seen how the current disparity will resolve. One scenario is gold breaks $1300 and this causes a mini-washout in the gold stocks and silver. The other scenario is gold continues to consolidate above $1300 and the gold stocks and silver firm in anticipation of a major breakout in gold. This is something that could take weeks to answer. In any event, we continue to remain patient and continue to accumulate the juniors we think have 5-fold potential over the next 18 months.


