Note: The following is a TA post. It tries not to focus on fundamentals or the negative potential sentiment setup that could develop when Coronavirus relief finally spreads across the land. It’s the short and long-term TA of it, as it stands now.
I am tempted to go into considerations about the sentiment implications of the Coronavirus, the re-strengthening real (as opposed to imagined by inflation-focused bugs) fundamentals for the precious metals and especially the miners. But instead we’ll review simple daily, weekly and monthly charts of ARCA Gold BUGS while avoiding or at least greatly minimizing confusing commentary interference.
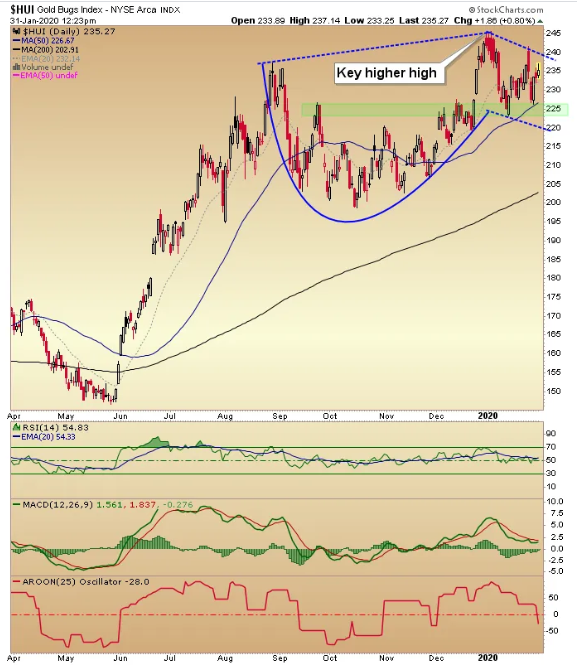
HUI Daily is in a Cup & Handle formation that I am pretty sure most everyone sees. But more importantly, the daily chart trends by the SMA 50 (intermediate) and SMA 200 (longer-term) are and have been sloping upward. Back on January 14 HUI held the noted support zone and the SMA 50, which kept us constructive (per parameters laid out in an NFTRH update that preceded it by 2 trading days on Jan. 9). The SMA 50 was sloping up and an uptrend is an uptrend until it no longer is (simple, eh?).
Elsewhere on the daily chart we see an RSI that could either be considered a negative divergence or a completely non-overbought indicator readying the market price for higher levels. MACD has not triggered up but is positive above zero and holds similar implications to RSI. AROON recently eased to negative, implying a short-term downtrend (which has been the Cup handle’s job).
Bottom line: AROON or no AROON, it’s an uptrend by the price above the very short-term EMA 20, the intermediate SMA 50 and the longer-term SMA 200. Period.

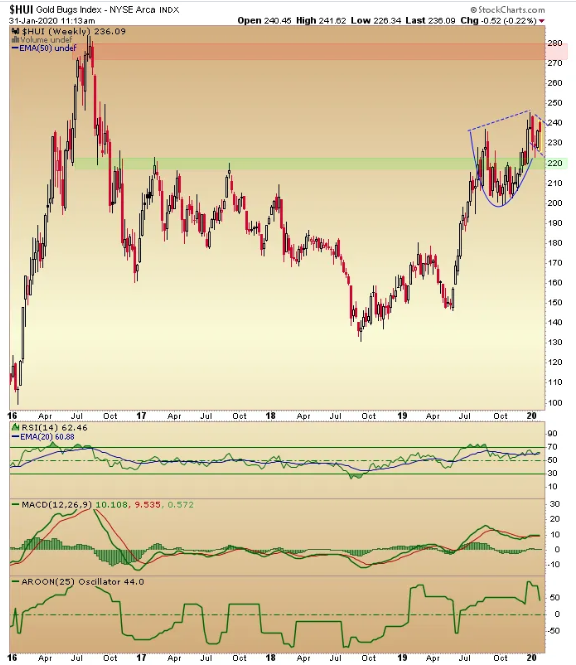
HUI Weekly is and has been an attractive specimen. That has been the case as long as it has held the 220 area support on the Cup’s handle-making. It has not broken out of the handle, but again if the negative RSI divergence is viewed in a positive light (i.e. a non-overbought situation) it would do so before long and target the 2016 highs (many of the individual stocks I hold and we chart have already taken out the 2016 highs in a sign of leadership). If the divergence is negative then there could be a negative surprise laying in wait for enthusiastic gold bugs. Here we note a potential market sentiment unwind related to Coronavirus as a risk (but this simple TA post should not be going there!). The current technicals are as they have been, constructive to bullish in line with the trends.

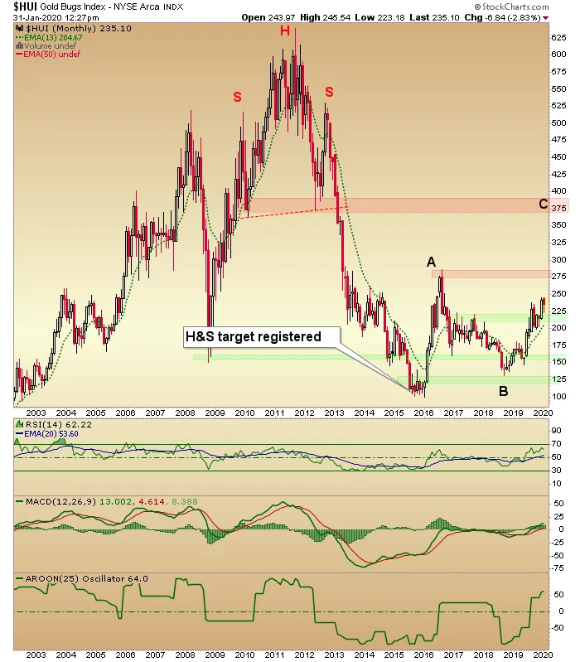
HUI Monthly gives the most bullish view of all as it backs out the short-term noise of the daily chart, the negative divergences of the daily and weekly charts and simply tells a story. That story begins with a bottom at the H&S target of 100, continues with the first up leg in 2016 (A), the long consolidation to kill the spirits of the 2016 bull herd and finally, a secondary low at the support of the 2016 cluster and point B of our theoretical A-B-C bear market upward correction scenario. It’s important to note here that gold stocks may very well be in a significant new bull market but I am calling it a bear market correction because there is no reason not to at this point with the target is still well higher at C.
As for the panel indicators, it’s all systems go. Positive RSI, MACD and AROON. Those are technical facts. With a continuing hold of the 220 area support on the current handle, the next target is the 2016 high with the objective of making a higher high, which then would firm the eventual 375 target (which may well prove conservative).

So there you have a simple technical view hopefully in clear enough terms. The gold stock sector has been bullish since June of 2019 and nothing in the charts above would dispute that beyond any short-term noise that may or may not enter the sector on the short-term, given today’s sentiment ripple across all asset markets created by the Coronavirus scare.
