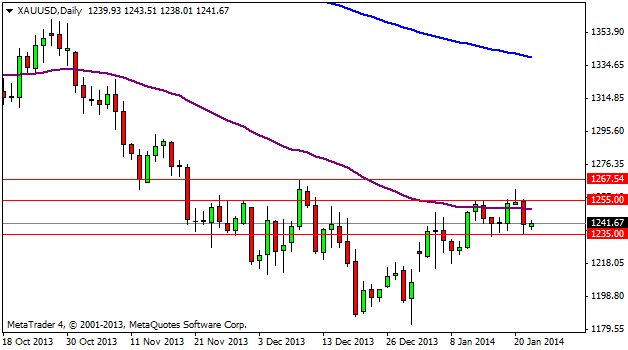
Gold has stayed in a range between the 1235 level as support and the 1255 level as resistance. We can see that prices have been oscillating around the 55 EMA (purple line) on the daily chart without choosing a direction. When any instrument goes into a consolidation, this can present us with very good opportunities to enter the market, because we already know that when price leaves the consolidation, speed and momentum picks up in the direction of the breakout. Obviously, in order for prices to leave the consolidation, new information must come into the markets to cause prices to move.

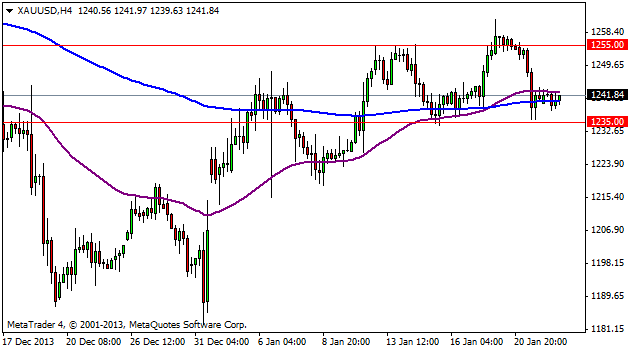
On the 4 hour chart, we can see that within the large range of the 1235 and the 1255, we see a smaller range between the 55 EMA and the 200 EMA. This type of price action can also be interpreted as a bearish flag or pennant. We call it a bearish flag, because the price trend coming into the formation is downwards, giving us a higher probability of seeing a breakout to the downside. But if we do see a breakout of the 1235 level to the downside, we know that we should wait then for the pullback before trying to go short on the precious metal.

