In Monday’s analysis, I wrote that the market situation is likely to become more specific right before, during, and perhaps shortly after the U.S. presidential elections. And by “specific”, I mean that the markets could begin moving against their previous trends.
Well, that’s precisely what we’ve witnessed so far. The overnight volatility is significant as the markets try to estimate the election outcome, with the odds keep changing quickly. Let’s start today’s market examination with the USD Index.
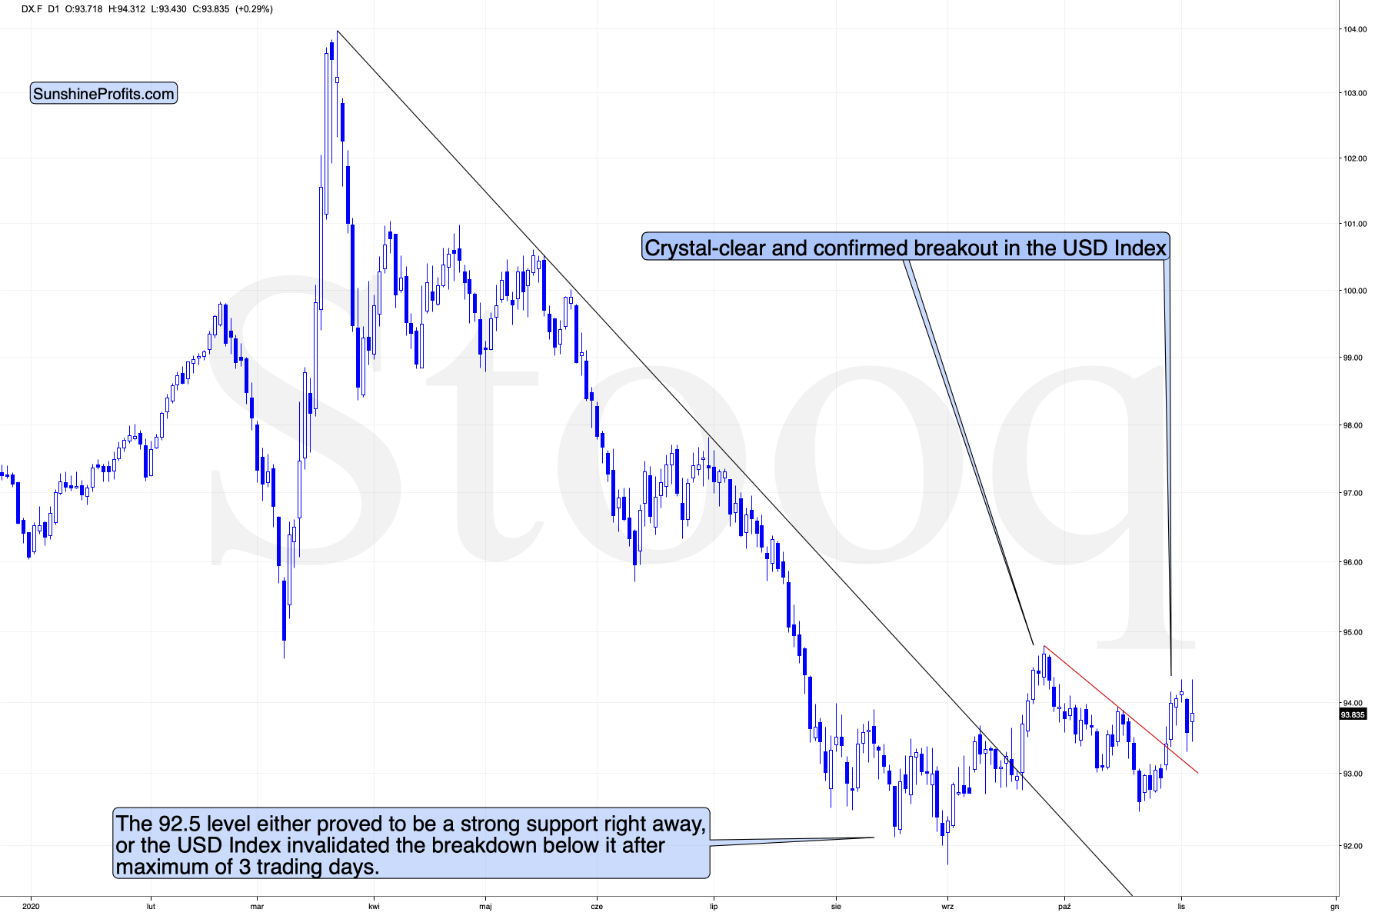
Yesterday, I indicated that I wouldn’t be surprised to see a corrective move lower that would trigger a brief move higher in the precious metals and mining stocks. I’ve also indicated that such a move would only be temporary, and most likely, it won’t last more than several days.
That’s what we have witnessed. Indeed, the USD Index has moved lower, almost touching the previously broken red resistance line. Yes, it rallied back up but then declined once again in today’s pre-market trading. Given the current political uncertainty, this is a relatively normal post-breakout behavior.
The key point is that the USDX didn’t invalidate the short-term, let alone the medium-term breakout. This means that—as I indicated yesterday—these moves are not a game-changer, but instead, they are a relatively normal uncertainty-based phenomenon.
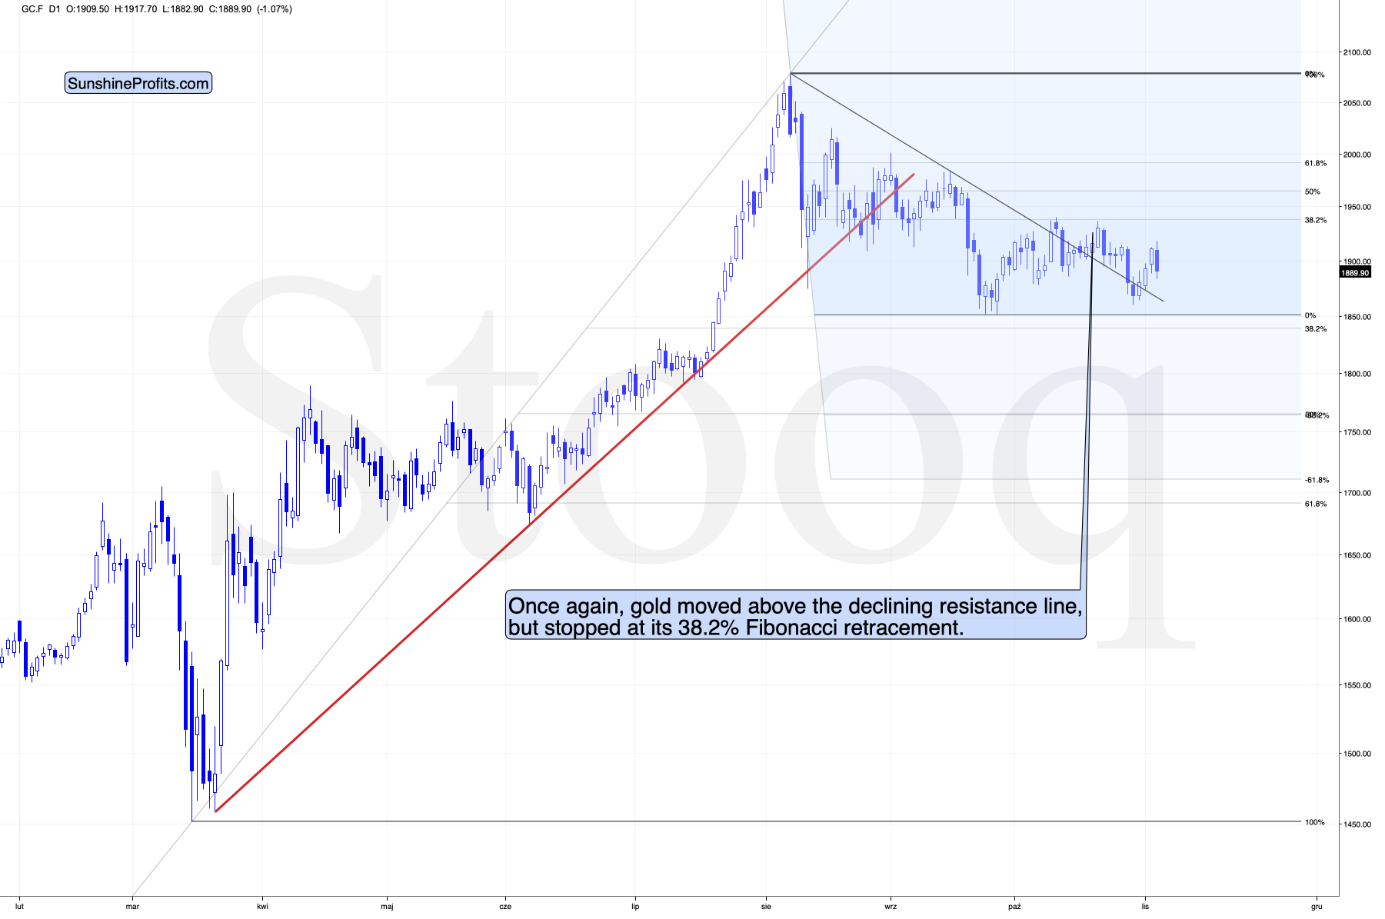
Gold moved higher yesterday, which erased those gains in the last few hours. So, is the uncertainty-based rally already over? It’s unclear. Given how great the uncertainty is, and regardless of the outcome, it’s likely to be taken to the Supreme Court (or at least heavily protested), the uncertainty might not disappear today.
And what about gold miners?
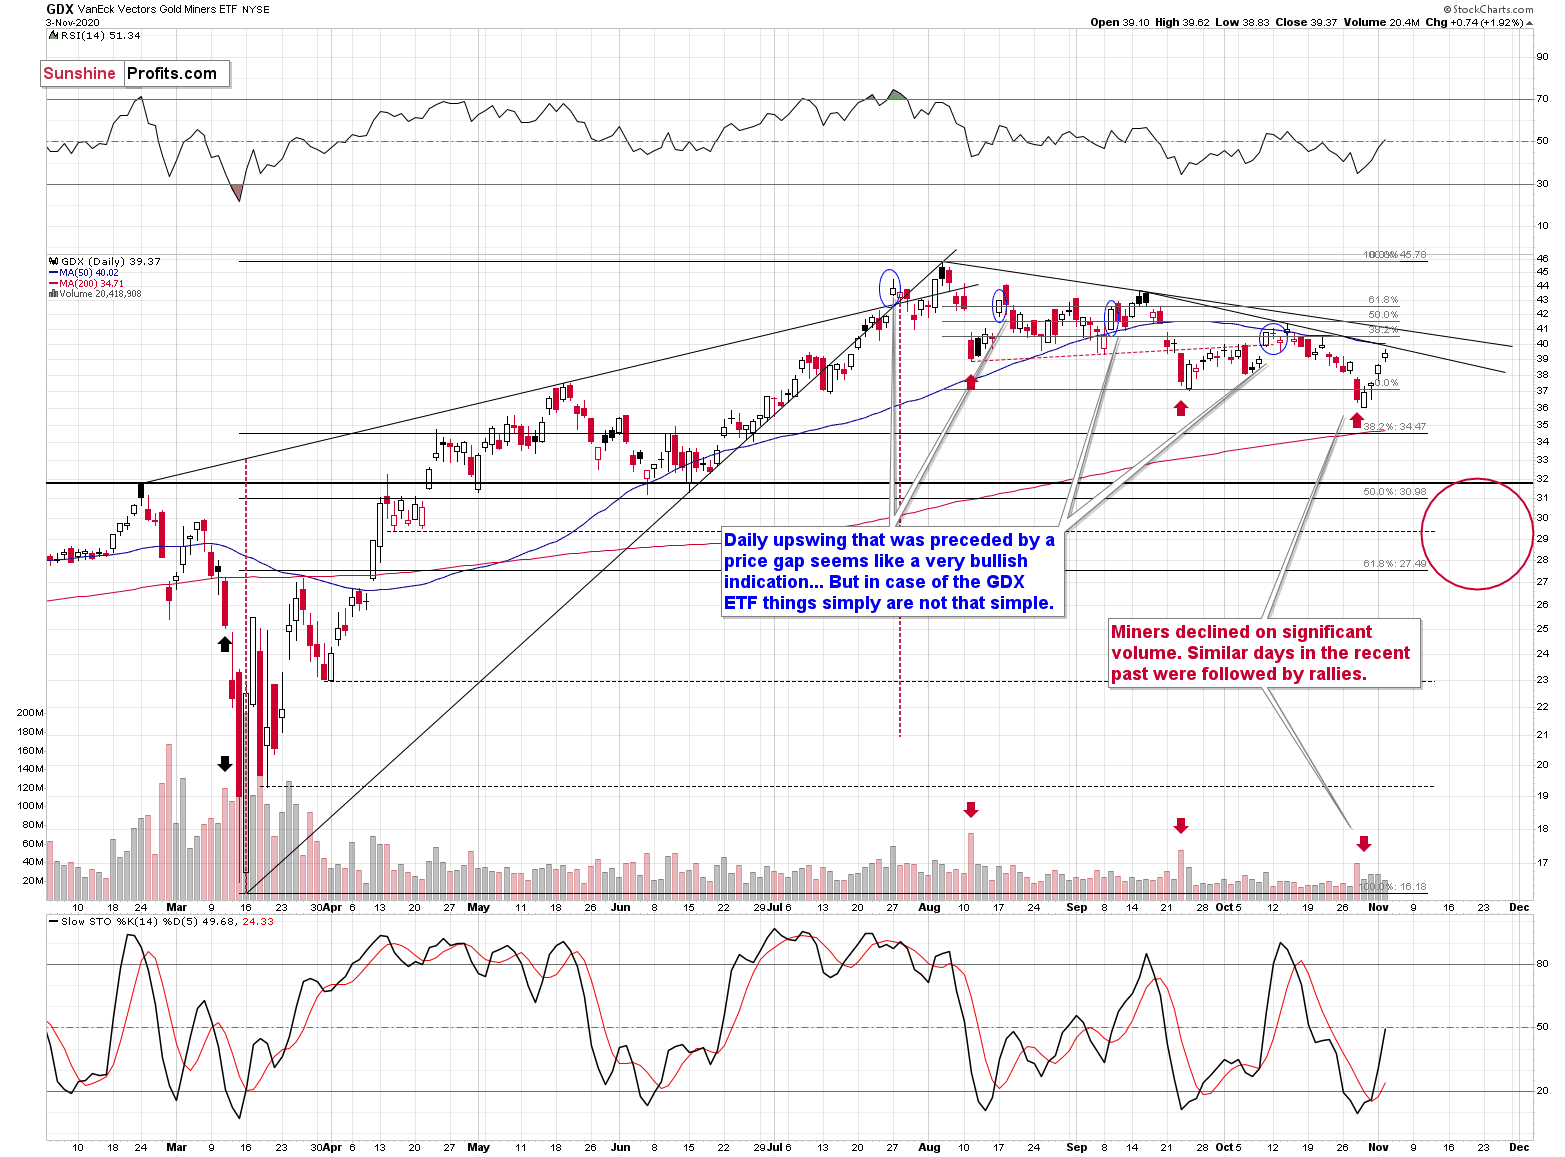
Miners rallied, almost touching their declining resistance line and the 50-day moving average.
On Thursday, after gold’s significant Wednesday decline, I’ve indicated the following:
- Miners have been undermining gold, which is bearish, and they have also broken below the recent lows, which is also bearish. Moreover, miners have just declined on strong volume after opening the day with a price gap, which at first sight, is bearish.
- The theory is that such sessions are particularly bearish, as they supposedly show the bears' strength. But, before applying any trading tip into practice, it’s important to check if it had indeed worked on a given market, especially in the recent past. And the aforementioned did work… In the opposite way!
- For the third time, miners are declining substantially during one day on a strong volume. We saw the same thing happening in mid-August and late-September. None of them were followed by lower miner prices. Instead, we’ve witnessed corrective upswings that didn’t change the overall downtrend.
So, from here on in, will miners rally or decline? Overall, the very near term (until the elections in the U.S. and a day-two after that) is unclear. At this point, a temporary rebound here would not surprise me at all, and if we see one, I expect it to be followed by a major slide. That’s precisely what happened right before and after the elections in 2016.
The summary above remains 100% valid. Miners moved higher, and given today’s pre-market move lower in gold, it seems that they will decline today. However, given how quickly things are changing regarding the political outlook, it wouldn’t be surprising to see a quick turnaround in gold and a daily rally before it finally plunges. So, it’s not a sure bet that miners have formed their top yesterday.
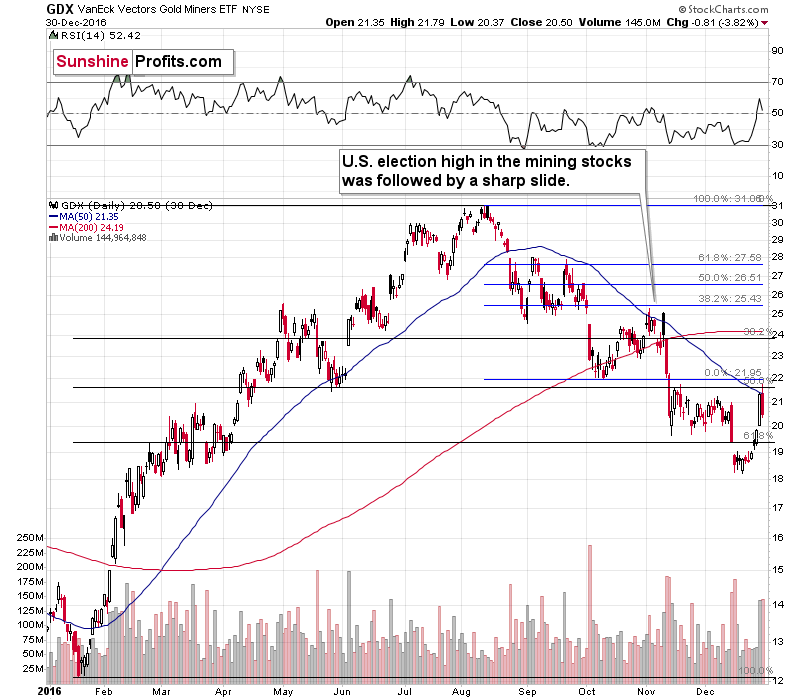
Back in 2016, right after the U.S. presidential elections, miners corrected to almost 38.2% Fibonacci retracement level based on the preceding decline, and they moved briefly above their 50-day moving average. Both levels are close to each other this time as well, with the retracement being slightly higher.
Yesterday’s move to $39.62 was below both levels. If GDX (NYSE:GDX) is to move above the 50-day M.A. once again, it would have to exceed $40.02, at least temporarily.
Back in 2016, GDX declined from about $25 to about $20 (20% decline) in few days. Could this happen again? It seems quite possible. This time, GDX is close to $40, so if it declined 20%, it would trade at about $32, which is the upper border of our target are and the February high.
There’s one more thing that tells us that while we might have seen the top yesterday, it was not necessarily the case.
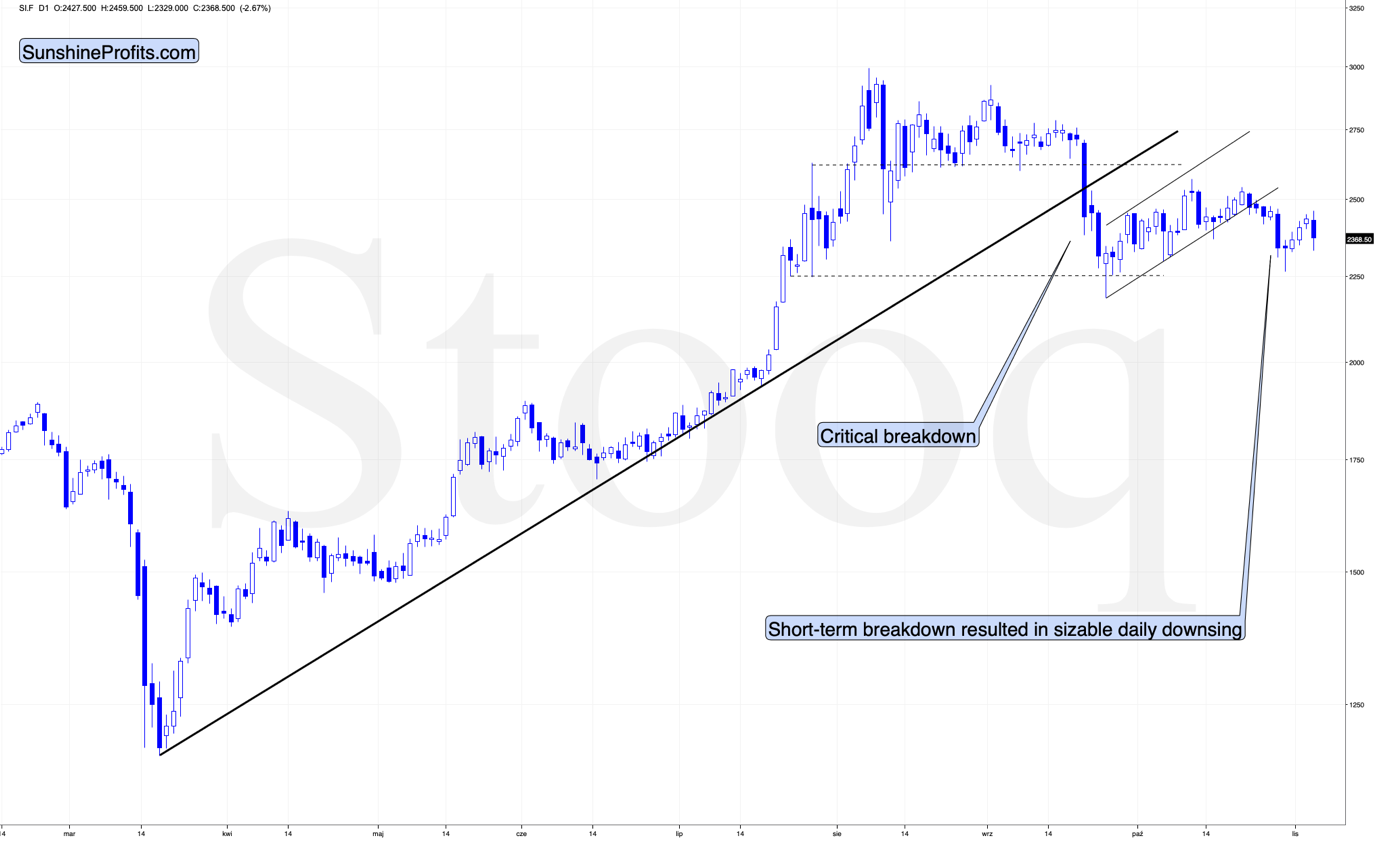
Namely, silver didn’t outperform gold yesterday, and miners were not week relative to it (on a day-to-day basis). These are signals that very often herald short-term turnarounds.
Their absence in yesterday’s trading is a clue pointing to the possibility that PMs and miners will move higher before topping. To be clear, we’re not talking about weeks here, but rather days, or perhaps hours. If silver comes back up strongly today while miners underperform, it will be an apparent signal that the short-term top is already in. Of course, the above is not a sure bet, as PMs and miners could decline right away based on their medium-term breakdowns, but it’s not 100% clear that yesterday was the ultimate short-term top.
