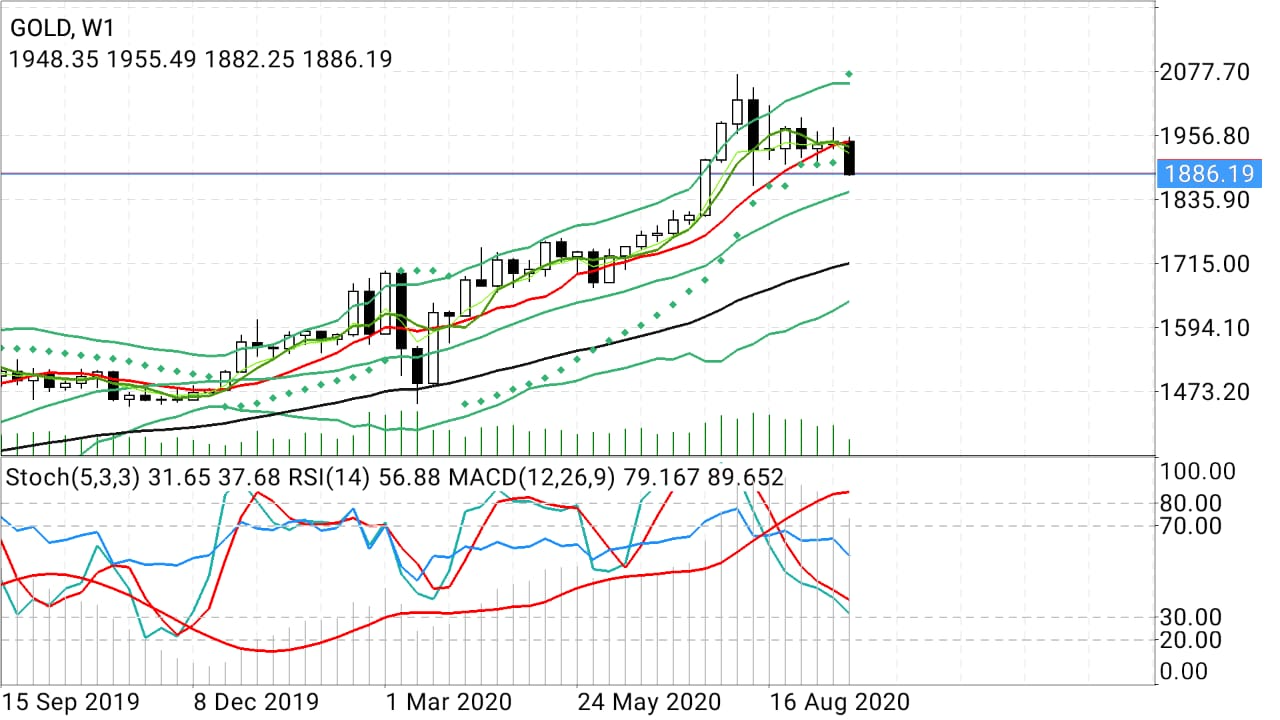
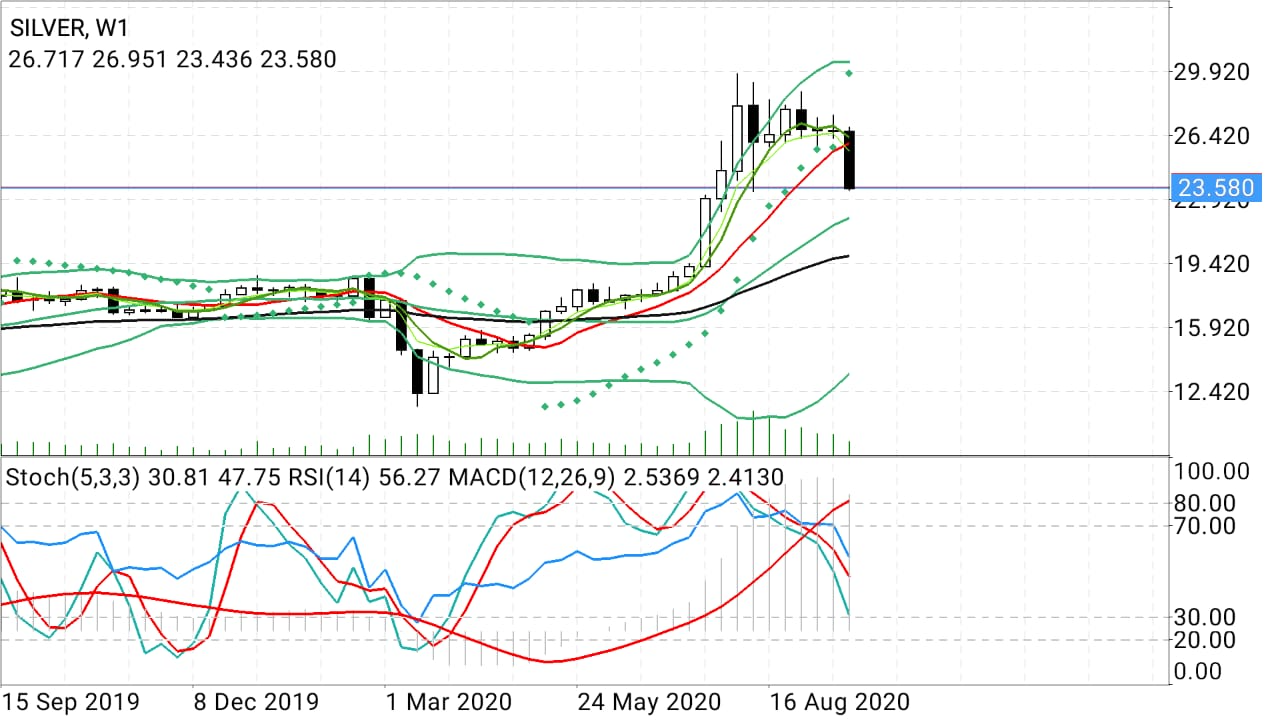
Precious metal bulls’ hopes of keeping gold and silver at above $1,900 and $23 per ounce—lows defended since August—may be fading
The dollar’s red-hot streak has sparked what could be the start of a new meltdown in the two leading shiny metals.
The greenback marked a milestone in its two-month long blitzkrieg Tuesday as the dollar index, which is weighted against six major currencies, reached 94.23. The DX, as the index is known, broke through the 94-handle Monday, the first time since July.
The spot price of gold, which tracks real-time trades in bullion, fell to $1,878, its lowest since July 24, extending the path below $1,900 opened up on Monday.
Gold Nears Oversold, But Slide Unlikely To Stop
In a blog on FXStreet, gold chartist Dhwani Mehta said:
“Gold has resumed its recent downside momentum, having confirmed a symmetrical triangle breakdown on the hourly chart, opening floors for a test of the pattern target near the August month lows of $1,863.”
Adding:
“Ahead of that level, Monday’s low at $1,882 could challenge the bears’ commitment. The path of least resistance remains to the downside, as the bearish Relative Strength Index (RSI) probes the oversold territory at 31.17, allowing for more declines.”

All charts courtesy of Sunil Kumar Dixit
She isn’t the only one whose near-term outlook has increasingly dimmed in recent weeks, contrasting sharply with the cheerleading for the haven just a few months back, as the yellow metal began climbing decisively from the mid-March bottom $1,451.50 to reach record highs of $2,073 by the first week of August.
Sunil Kumar Dixit is another gold technician who thinks that a break below $1,860 may be in short order.
Dixit said:
“Having lost the psychological $1,900 handle, gold seems to be falling to gravity and heading for a test of the 100-Day Simple Moving Average of $1,865.”
He said gold’s slide will likely accelerate once DX gets to 94.60.
“Buyers can come back around this level for some bounce back towards $1,900. A sustained move above $1,900 may take gold up to the resistance cluster of $1,911-$1,927-$1937, where bears shall wait to again beat the metal back toward $1,836. Any lack of will to defend the $1,800 level will only add to the bears' resolve to hammer it down to the $1750-1700 levels.”
Mehta’s charts seem to be in concurrence with Dixit on this.
“Only a sustained move above the 100-HMA at $1931 could likely offer some reprieve to the XAU bulls,” she wrote in her blog.
Gold Could Go Under $1,700, Silver Below $20
A strong reversal for gold could come at $1,690 which should be “the point of reversal”, marking a higher low after the now famous March bottom of $1,450, according to Dixit. She adds:
“If the stars align well for gold at this point and DX starts its reversal to reach below 92, it should propel the yellow metal to fresh record highs of $2300-$2,500 in the next bull wave.”
Silver, meanwhile, could head for total collapse, with the spot price having already lost its $24 per ounce handle and risks lows at $22.40, $21.90 and $19.90 next, according to charts.

Kyle Quindo of Blackbull Markets Limited offers an explanation:
“Investors who invest in metals and commodities such as oil, silver, and gold tend to put their capital into ETFs backed by metals, instead of buying futures or the physical metal, primarily due to low transaction costs.”
“However, investors have started to take money out of these ETFs, especially silver-backed exchange-traded funds—raising worries that the rally in silver might be over.”
He noted that the iShares Silver Trust (NYSE:SLV) has seen a 3% outflow in silver holdings over the past month to reach 555 million ounces.
While a near-term relief rally could put spot silver back in the $24.80 spot, charts show selling could resurface if it tests $25.50, especially if DX remains the juggernaut it is.
Dollar’s Strength Continues To Perplex Many
Just how did the dollar get this strong?
Given the yawning U.S. fiscal deficit and concerns of economic recovery still being restrained somewhat by the six-month long coronavirus pandemic, many precious metals bulls have been caught off-guard by DX’s uncharacteristic surge.
Some analysts, however, point to exogenous factors such as the underwhelming recovery of the U.K. and European economies compared to that of the United States amid COVID-19.
U.S. housing, employment, auto sales and general consumer sentiment have registered growth, albeit slowly, since July, despite the absence of new stimulus spending. All these have given the dollar a bid while weakening gold’s case as a counter haven.
Global events have also bolstered the dollar, with renewed U.S.-Sino tensions adding to the strength of the greenback, which has positioned itself as the default trade to the Trump administration’s war of words with China.
On Monday, Federal Reserve Chairman Jerome Powell further endorsed the U.S. financial recovery since the near 33% slump in second-quarter GDP sparked by the coronavirus pandemic.
Powell made no bones of the fact that another stimulus package was critical for the recovery to continue though he alluded to the probability of it not emerging due to the tussle in Congress between the administration and Democratic lawmakers.
Disclaimer: Barani Krishnan does not own or hold a position in the commodities or securities he writes about.
Which stock should you buy in your very next trade?
With valuations skyrocketing in 2024, many investors are uneasy putting more money into stocks. Unsure where to invest next? Get access to our proven portfolios and discover high-potential opportunities.
In 2024 alone, ProPicks AI identified 2 stocks that surged over 150%, 4 additional stocks that leaped over 30%, and 3 more that climbed over 25%. That's an impressive track record.
With portfolios tailored for Dow stocks, S&P stocks, Tech stocks, and Mid Cap stocks, you can explore various wealth-building strategies.
