We've made mention in recent missives of the capability for Gold's price to travel a great distance in merely a day, (as was noted by 131 points from low-to-high on 26 September 2011, or as we saw last year on 15 April 2013 from high-to-low by 160 points). Brought to us, of course, in part by the COMEX not imposing daily high/low price limits on Gold, in concert with the furious one-sided trading thrust on the part of central banks and/or hedge funds hoovering away all of the standing bids and/or offers.
Remindful of this was from that which I heard on the radio a few mornings ago. Almost as if 'twas preordained, I flipped on the bedside set in the wee hours to coincidentally catch the tail-end -- but likely the most salient part -- of an interview with seasoned financial wizard Jim Rickards. His being pro-Gold, he emphasized the importance of one's buying the yellow metal now, (in bullion form rather than via equities), to thus avoid the anxiety of seeing from the sidelines Gold suddenly rising by $100 per day, and then one's capitulating to finally buy after the price is already up to $3,000/oz. Given this being the reality of not "if" but "when", 'twas quite the brilliant and yet common sense point. Well done James.
'Twas further remindful of a pending paradigm shift we've been considering for some time, that of a material movement by the investing public at large away from the stock market toward hard assets. Not that everybody shall comprehensively abandon the stock market, but having been undone back in '00-to-'01 (S&P -51%), and then again to have beared the decline of '07-to-'09 (S&P -58%), this next crash for which we remain vigilantly watchful is bound to leave a lot of folks scratching their heads. Once burned, twice shy is one thing; but thrice thrown into the fire begs the question: "What else ya got?"
Alternative investing vehicles such as hard assets may well gain popularity en masse. We've of course all heard the frequent radio adverts in recent years for Gold and Silver. But this past week I heard for the first time an advert for Oil. Time to rush out there and buy your own derrick! Whilst I hardly expect the majority of investors to suddenly become commodities traders, let alone hard asset owners, I'd watch for a further proliferation of ETFs of all sorts, sizes and leverage multiples, with 24-hour trading windows in mirroring the futures markets, to become the next Big Thing in wealth vehicles from 401Ks to day-trading accounts across a much larger percentage of the investing public. (Recall that Gold is perhaps at best represented in just 5% of managed portfolios).
In the meantime, specific to the stock market, from the days of the DotBombs through the SubprimePredators, to what we anticipate shall be today's FacePlants, the signs certainly are there for the next market meltdown. Our "live" measure of the S&P's valuation remains high at 28.9x, and the Index itself (1881) essentially where 'twas both one and two months ago in spite of all the encouraging economic data which is causing our barometer to rise:
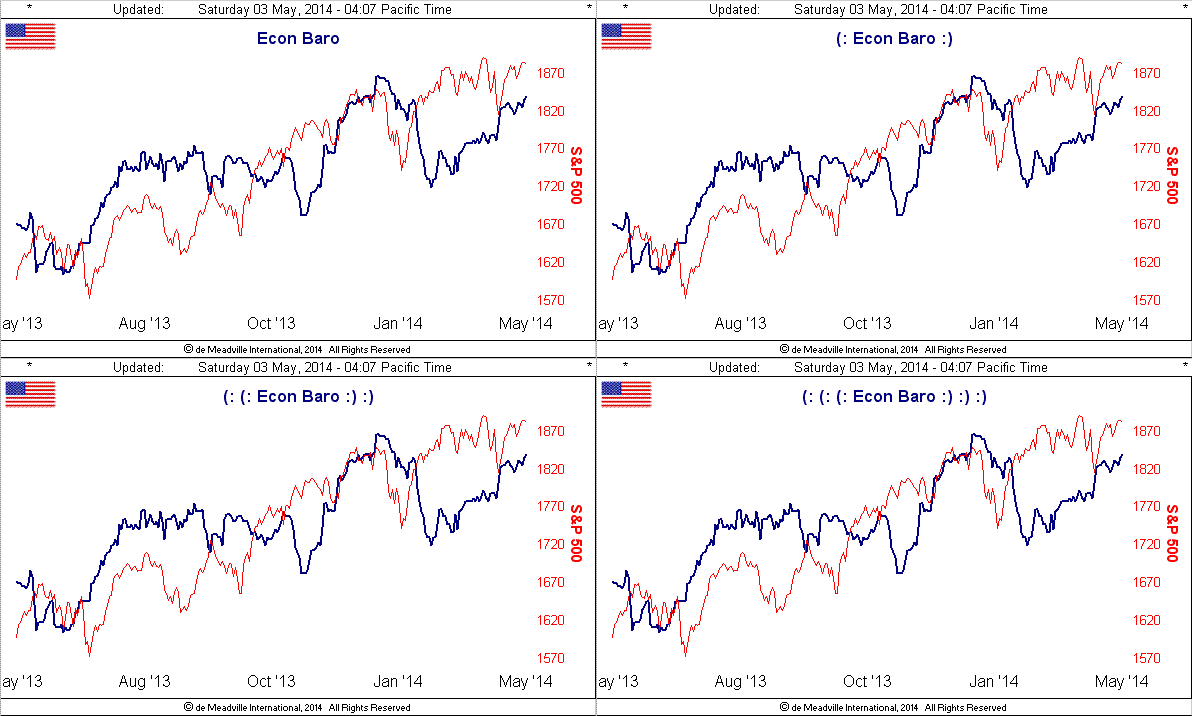
Indeed the whole reason we created the Econ Baro back in 1998 was to remove the guesswork of trying to piece together in one's head a resultant picture from the persistent flow of incoming data, to therein discover as well that the Baro leads the S&P: or at least it used to so do. As a valued reader of The Gold Update and director of money management said in a recent tele-conference to clients [paraphrased]: "...market metrics that have worked for better than 30 years don't anymore..." What's wrong?
The data that feeds the Econ Baro is only as reliable as 'tis reported.
"What are you inferring, mmb?"
Provably nothing, Squire. Yet from the "Hearsay Dept." the economy's ability to eke out a +0.1% GDP gain in Q1 was courtesy of the Commerce Dept.'s calculating a slower rate of growth in its Price Index. And then just yesterday (Friday), the Labor Dept. announced stellar April job growth with quite the reduction in unemployment, (quietly sweeping under the table the lowest job participation rate in 36 years).
Still, the Fed's Taper Caper continued this past week, the FOMC voting to pump dough into the economy at better than $2 billion per work day. Admittedly we've been speculating that were the Econ Baro, instead of rising, be declining, that there would not be a further tapering at the mid-June meeting. But now, at least as lead by the Baro, it looks as though they'll still taper toward less paper, (barring a Baro belly-flop in the interim).
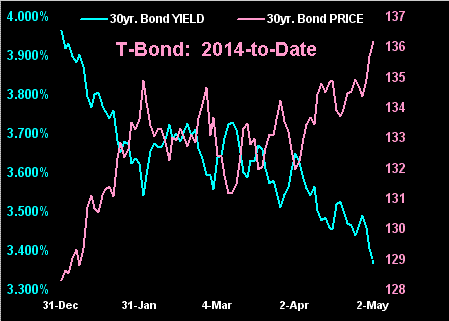
And yet throughout these dizzy days of the towering (soon to be tipping?) S&P and seeing through the economic haze are two markets that may be the wiser, toward an inevitably weaker Dollar. One is, of course, Gold, which we'll go over in the usual graphic detail. But the other is the Bond market. Was it not suppose to have been long since crashing by now? Seems as if reports of its death have been greatly exaggerated. If anything, 'tis been soaring, ranking second in performance year-to-date (+6.4%) only to Gold (+7.9%) within our BEGOS Markets spectrum. The following chart shows us the 30-year Bond's performance thus far in 2014, its futures price in rose and yield in blue:
"Who knew?"
A look at the burgeoning Bond suggests the Econ Baro is perhaps being belied by the data it receives. If so, reality shall only right it in due course. “What's the whole point of being pretty on the outside when you’re so ugly on the inside?” --(Jess C. Scott).
Who knew, indeed. Gold knows. Amidst its many positives that we regularly enumerate, price continues to remain firm in spite of the parabolic Short trend's having now been in place for five weeks, per the rightmost red dots:
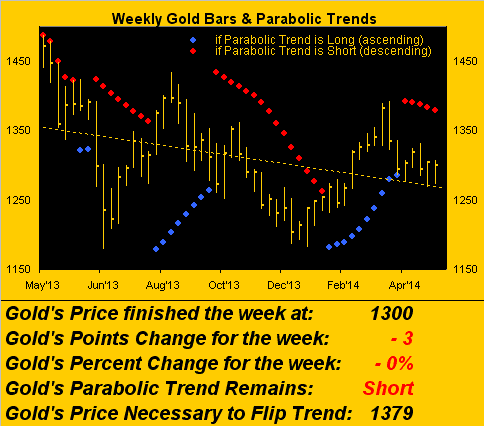
At least to this point, such "descending trend" looks no worse than a near-term consolidation within the overall broad-term consolidation.
As we next turn to Gold's 21-day linear regression picture, let's bring along Sister Silver as well as in viewing their respective daily bars and "Baby Blues", the dots which define trend consistency:
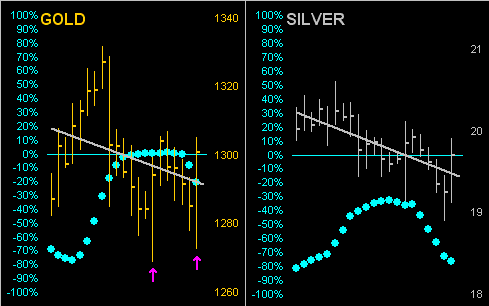
Note the two arrows on Gold's panel: they depict very resilient "power bars", (from both 24 April and yesterday), wherein hard selling early in the session was then met with even more vigorous buying, driving price well above the prior days' closes. One gets the sense that price sub-1300 is perceived as an absolute bargain, (as is sub-1900, below which price is lagging behind growth in our StateSide M2 money supply alone, hint/hint, nudge/nudge, elbow/elbow...). As for the Baby Blues, they are now in decline for both metals, albeit Silver's dots show her as the weaker of the pair as she's been donning her industrial metal jacket more often this year in sympathy with the S&P than her precious metal pinstripes.
From the standpoint of reliable Market Rhythms, for the third week in a row we bring up this paired graphic of two of the best: the MACD (moving average convergence divergence) on the daily bars for Gold and Silver. Of late, these time-proven measures for profitable trading have become a bit whippy...
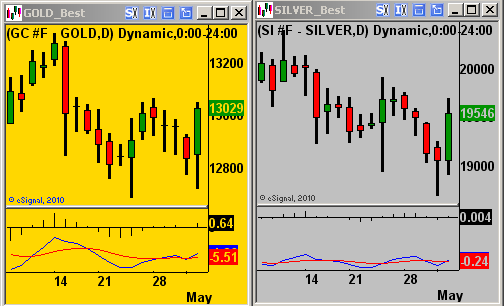
...the good news being that should Friday's buying surge continue into the ensuing week, the attendant MACDs ought reflect more definition and thus duration for these new upside crossovers. (The profitable signaling quality of these measures is on our Market Rhythms page).
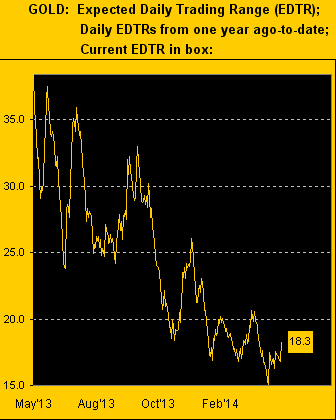
Not unexpectedly, Gold's volatility is on the increase. As culled from our Market Ranges page, follows is the EDTR ("expected daily trading range") from a year ago-to-date for Gold, its gauge now on the rebound at better than 18 points per day:
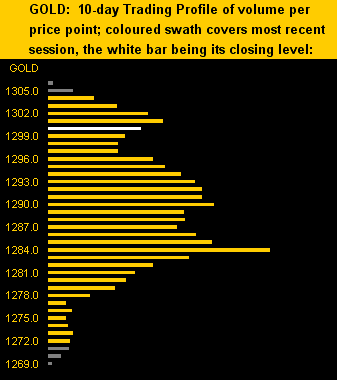
Indeed, Friday alone spanned 32 points from low-to-high as shown below per the Golden Swath across almost the entirety of Gold's 10-day trading profile. Settling yesterday at 1300 (white bar), price sits just below the 1301 resistor, as further supported by the profile's other apices at 1290 and 1284:
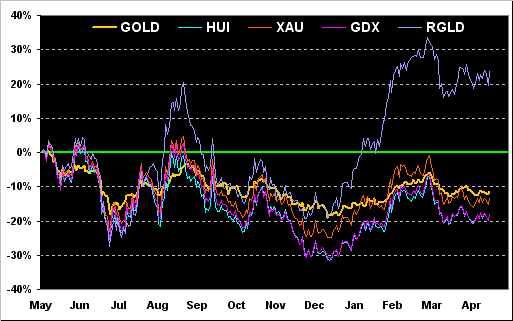
Meanwhile, the Gold Gang at large remain down percentage-wise from this time one year ago. But as an exception: the wheelin' and dealin' royalty company Royal Gold (NASDAQ:RGLD) is up a twinkling 24% as you can next see. And as another month is in the books, 'tis time we go year-over-year also with Gold itself, the Gold Bugs Index (HUI), the Philly Exchange Precious Metals Index (XAU), and the exchanged-traded miners fund Market Vectors Gold Miners (GDX):
Lastly, 'tis finally happening: purchasing power perceptions indicate that China -- and yes I know a lot of you are convinced from the FinMedia headlines 'tis instead the now roaringly robust UK -- but rather 'tis China which is now en route to passing the USA as the world's largest economy. And why not? China is like Texas: everything is BIG. Yes its land mass is almost identical in size to that StateSide, but there are 425% more folks living on it. The USA was established 238 years ago; China's first emperor was bollocking about back some 2,235 years ago. Number of ethnic groups? USA 6 ... China 56. China's calling code is 86 vs. the US' paltry 1. Why even Beijing is 12 hours ahead of New York City. And to rub it in locally, just across the street here is the PRC's consular residence, sitting on the single largest residential real estate lot in the City of San Francisco. So throw in the towel America! Yes, it may be Kentucky Derby Day over here, but in the Year of the Horse, 'tis China that gallops toward the head of the pack.
And they love Gold!