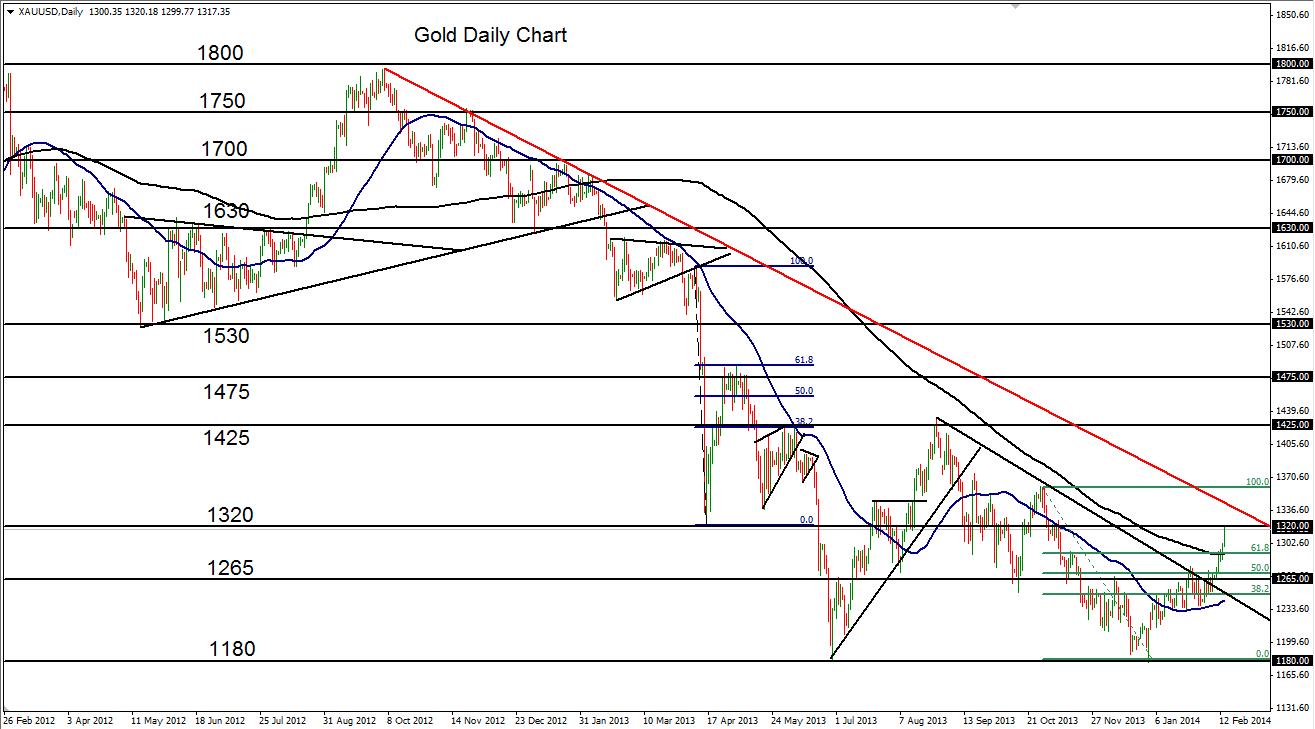
Gold (daily chart shown below) has risen above its 200-day moving average for the first time in a full year. Not since February 2013 has gold traded above this major moving average.
The daily price close above the average occurred on Thursday, with Friday, showing further marked strength for the precious metal.
This bullish move occurs within the context of a longstanding bearish trend, still currently intact, which extends back to the October 2012 high near 1800.

From the double-bottom low of 1178 at the very end of 2013, the current advance represents a full upside correction of around 12% so far.
Having broken out above both the 200-day moving average as well as the 61.8% Fibonacci retracement of the last major decline, gold’s bullish momentum has just reached an intermediate resistance level around 1320.
Any further upside extension of this bullish correction should find dynamic resistance around a key downtrend resistance line extending back to the noted October 2012 high near 1800.
A breakout above that trend line would create the potential for a break of the long-term downtrend, with further major resistance around the 1425 level.
The key downside support level to watch continues to reside around the 1265 price area.
Disclosure: FX Solutions assumes no responsibility for errors, inaccuracies or omissions in these materials. FX Solutions does not warrant the accuracy or completeness of the information, text, graphics, links or other items contained within these materials. FX Solutions shall not be liable for any special, indirect, incidental, or consequential damages, including without limitation losses, lost revenues, or lost profits that may result from these materials.
The products offered by FX Solutions are leveraged products which carry a high level of risk to your capital with the possibility of losing more than your initial investment and may not be suitable for all investors. Ensure you fully understand the risks involved and seek independent advice if necessary.
