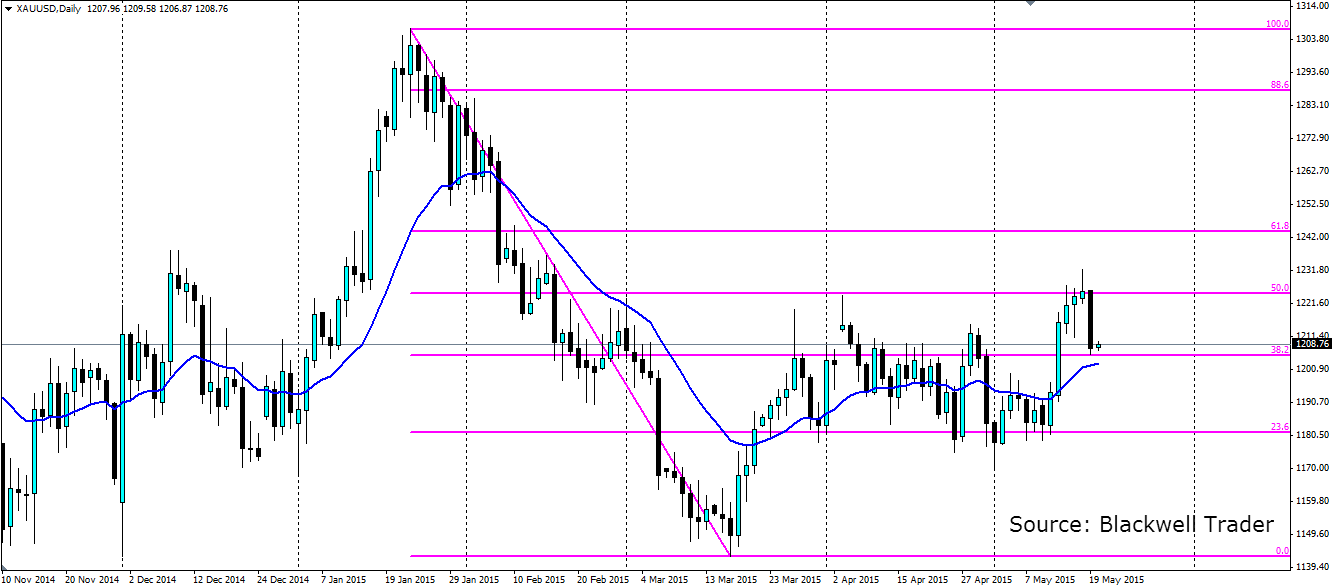
Gold has been range-bound recently as the markets debates the likelihood of an interest rate rise from the Fed this year, and the relative strength of the US economy. The lack of direction has seen gold look to some predictable levels of support and resistance, and these are found along Fibonacci lines.

The data out of the US has been rather lacklustre lately as the risk of a downturn in economic activity increases. This has led many to speculate on the likelihood of an interest rate rise from the Fed. June looks to be all but off the cards at this stage thanks to weak Q1 GDP figures (0.2% annualised) and a disappointing Trade Balance among other indicators. The Labour market seems to be the only sector returning strong results, but these results can be subjective and the headline figures should be taken with a grain of salt.
This back and forth has ensured gold remains within the current range, stuck between the 23.6% and 50.0% Fibonacci lines on the chart above. Last night’s strong building permits figure was the positive indicator the market had been waiting on and the gold bears certainly took their chance. The move found support with a perfect touch on the 38.2% fib line.
The range looks to be holding firm for now, and we are likely to see gold continue to respect the Fibonacci lines as support and resistance. The lack of clarity from the Fed, coupled with some very mixed data out of the US at the moment will likely lead to gold remaining range-bound for some time.
Look for resistance at $1,224.50 an ounce (the 50% fib line) with $1,243.83 likely to provide further resistance at the 61.8% line. Support is currently found at the 38.2% line at $1,205.19 with further support found at $1,181.19 or the 23.6% line and of course the previous swing low at $1,142.62.
