Gold prices were down sharply over the first half of the week as the US Dollar rallied up to fresh 2018 highs. However, as the Dollar retreated from the lofty levels posted initially on the week, gold was able to recover some of its losses to end the week positive.
The US Dollar continues to rally on increased Fed tightening expectations following the release of better than expected 3Q GDP which endorses the Fed’s view that the momentum in the economy is solid and warrants further gradual rate increases.
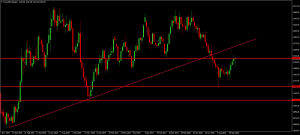
The rally in gold has taken price back up to retest the underside of the broken December 2017 low of 1235.30 which is holding as resistance for now. Above there, the focus will be on a test of the broken rising trend line from 2015 lows. To the downside, the 2018 low of 1158.84 is the first key level with the late 2016 low of 1121.63 below that.
Silver
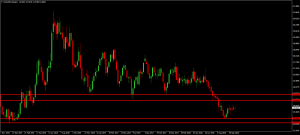
The stagnation in silver prices is reminiscent of the price action seen earlier in the year before we got that big sell-off over the summer. Weaker equity prices and a stronger US Dollar have kept silver upside constrained while its correlation with gold (supported by safe-haven inflows) continues to provide upside pressure.
Silver prices remain sat just above the 13.6704 – 13.9612 level support which has stemmed the decline for now. However, unless the price makes it back above the 15.1825 – 15.5734 level, the focus will be on the further downside
.
Copper
The red metal was lower once again this week, posting its third consecutive weekly loss as renewed concerns over the trade war between the US and China as well as the impact of the stronger US Dollar combined to weigh on price. Trump warned the market this week that he stands ready to unleash a new wave of trade tariffs on China worth billions if the two countries cant strike a trade deal. Such news has caused fresh panic selling in copper, exacerbated by the stronger US Dollar, only buffered by the pullback in the Dollar late in the week.
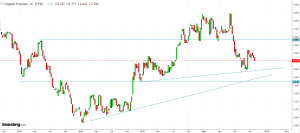
The current technical formation in copper is very interesting indeed as we are potentially seeing the formation of a large sloping Head and Shoulders pattern with a neckline along the first rising trend line shown. If this is the case and we see a break of that neckline, this could pave the way for much deeper losses in copper. The key structural level to the downside is around 2.443.
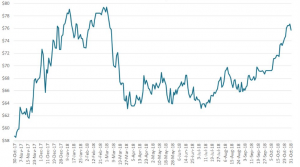
After a strong rally over recent weeks, with prices surging by over 20% in 3 months, iron ore prices softened a little this week as the impact of a stronger US Dollar tempered the upside move. Adding further downside pressure was the weakness in Chinese steel markets which softened in response to the latest data showing Chinese manufacturing growing at its slowest pace of the last two years over the prior month, confirming fears that the trade war with the US is negatively impacting activity.
The rally in iron ore over the last few months has taken price all the way back up to just shy of the year to date highs around the $79 mark with price sitting just a few dollars below this level. For now, the focus remains on further upside. If we see a deeper retracement lower from here, the key support base to watch will be a retest of the breakout zone around $70 where a raft of broken prior highs should provide support.


