Key Points:
- 2-bar reversal pattern evident on daily time frame.
- Gold likely to remain bullish in coming week.
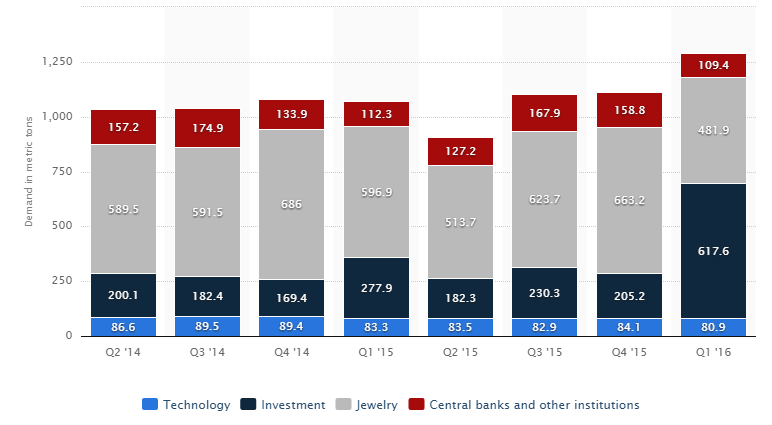
- Physical demand remains buoyant in Q1, 2016.
The past few weeks have been relatively negative for gold as the precious metal largely failed to benefit from the Fed’s continuing prevarication over potential rate hikes as well as the ongoing political strife in Turkey.
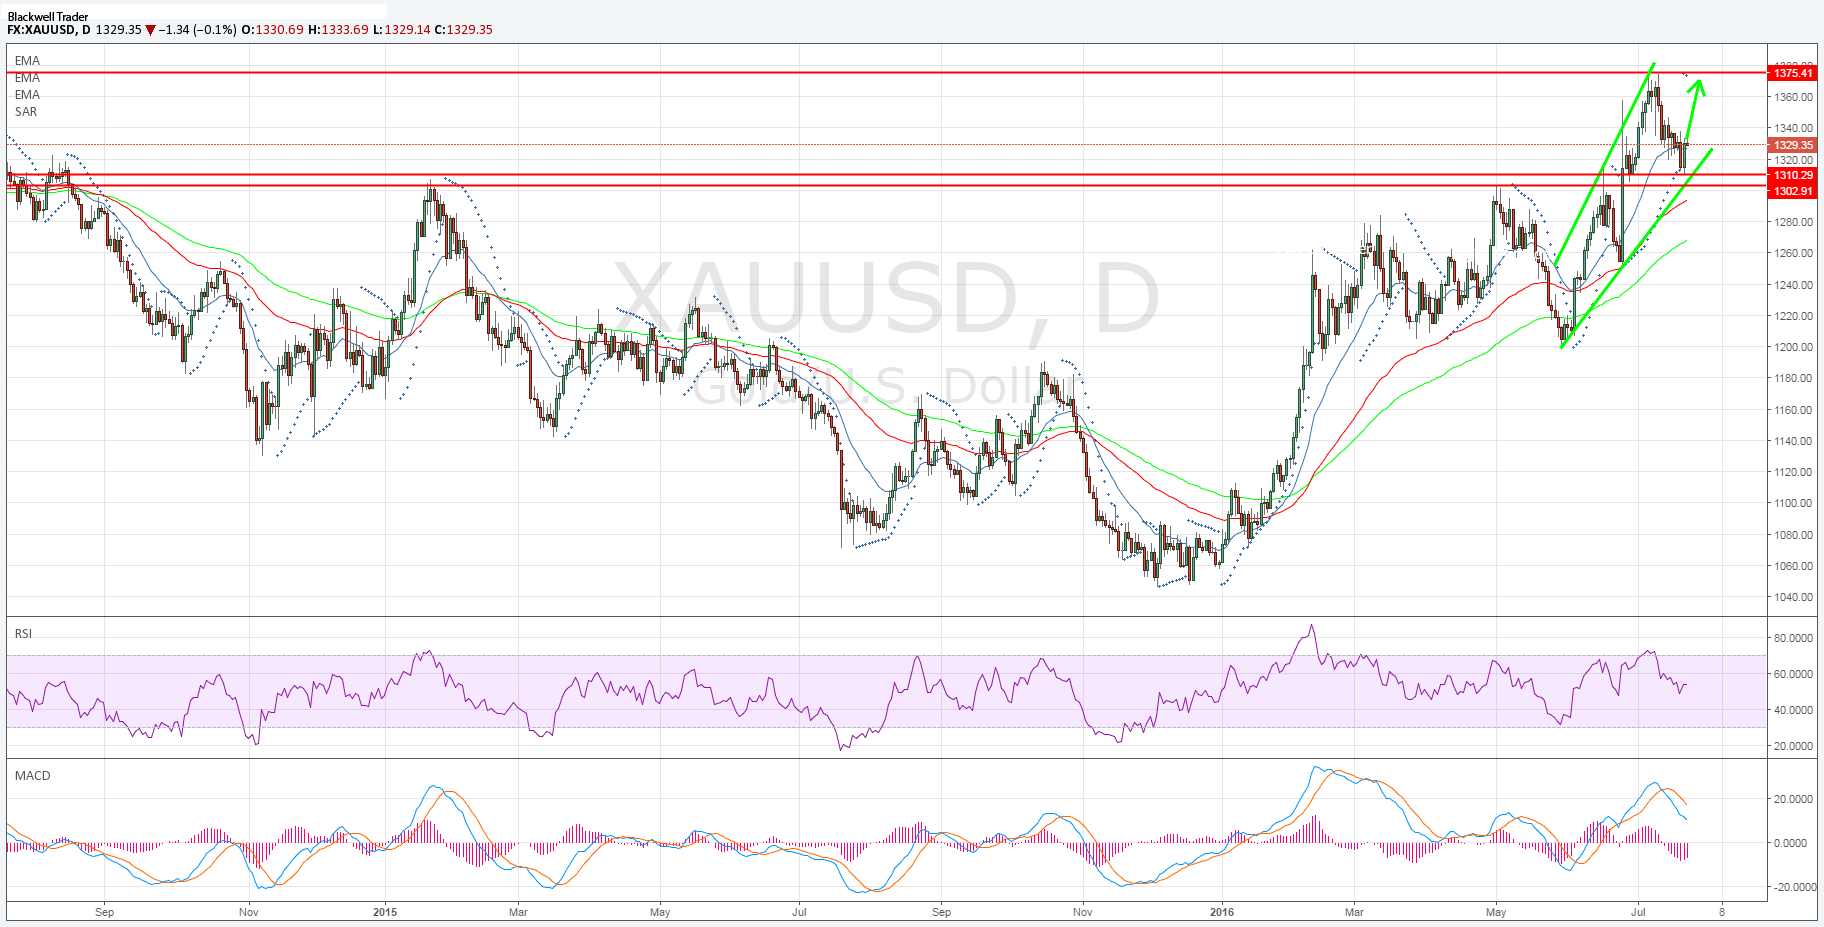
Subsequently, the metal has been declining steadily over the past few weeks from its high of $1375.41. However, the commodity might finally be turning the corner as some bearish signals appear on the daily chart.
In particular, the daily chart is demonstrating a 2-bar reversal pattern which is likely to mean a significant bullish move for the metal in the coming week. Also, coinciding with the appearance of the reversal pattern is a relatively strong buy zone and the 50% Fibonacci level. In addition, the RSI Oscillator appears to have moderated and subsequently ticked higher within neutral territory.

In addition, the strong divide between the physical and derivative markets continue for both gold and silver but fundamentally gold has been catching up over the past few months as the risk sentiment increases. Subsequently, there are plenty of reasons, both fundamental and technical, to remain bullish over the metal in the coming weeks.

Ultimately, following the appearance of the 2-bar reversal pattern means it is highly likely that gold will rise to challenge the $1375.41 high in the medium term as long as price action can remain within the current channel.
However, be aware that there is a risk event looming next week in the form of the US Federal Reserve FOMC meeting. Although, the Federal Fund Rate is largely expected to remain steady at 0.50% the post meeting rhetoric could impact the precious metal strongly.
