The consolidation in the Gold price is continuing as markets lack direction. The squeeze in the price has left the market primed and ready for an explosive once it does finally break out of the pennant that has been forming.
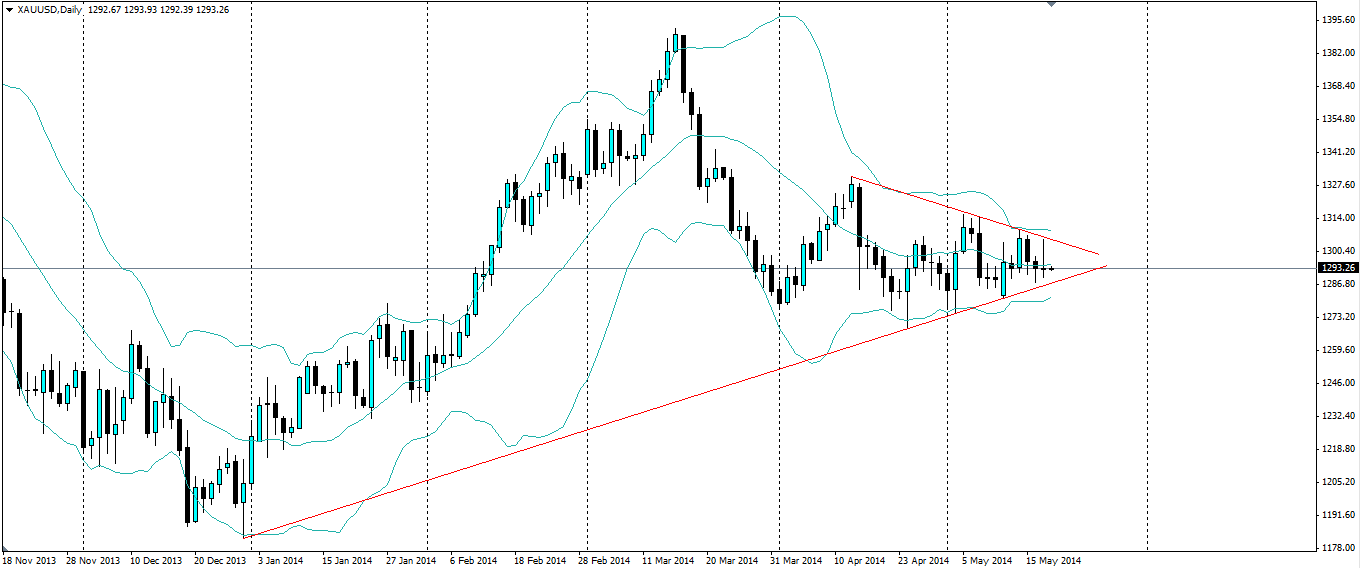
I wrote on this subject last week as it looked like the consolidation was coming to a head. At the end of last week,the price had a slight breakout of the pennant but it was not sustained and the price was quickly pushed back inside. The price is still respecting the bullish trend line and it looks quite solid, so this line will remain in place. The bearish line, however, can be redrawn since this false breakout and it seems to be more in line with what the Bollinger Bands are showing us.

The Bollinger Bands ® held firm when the price tested the upper band at the end of last week, keeping the price in check and maintaining the squeeze on price which has seen the bands at their tightest levels since August 2007 on the D1 chart.The upper and lower bands are based on the standard deviation, which is a measure of volatility. In theory, periods of low volatility are followed by periods of high volatility and generally, when the price breaches one of the bands, it is the signal for a new movement. The direction of the movement depends on which band is broken.
Fundamentally, there isn’t too much on the horizon that could shift Gold prices. Various FED members are due to speak this week, with Chairwoman Janet Yellen the most important of them all, and this could provide an insight into the thinking of the FED when it comes to US interest rates. US Initial Jobless claims figures could have an impact on Gold as it gives an indication of the health of the economy.
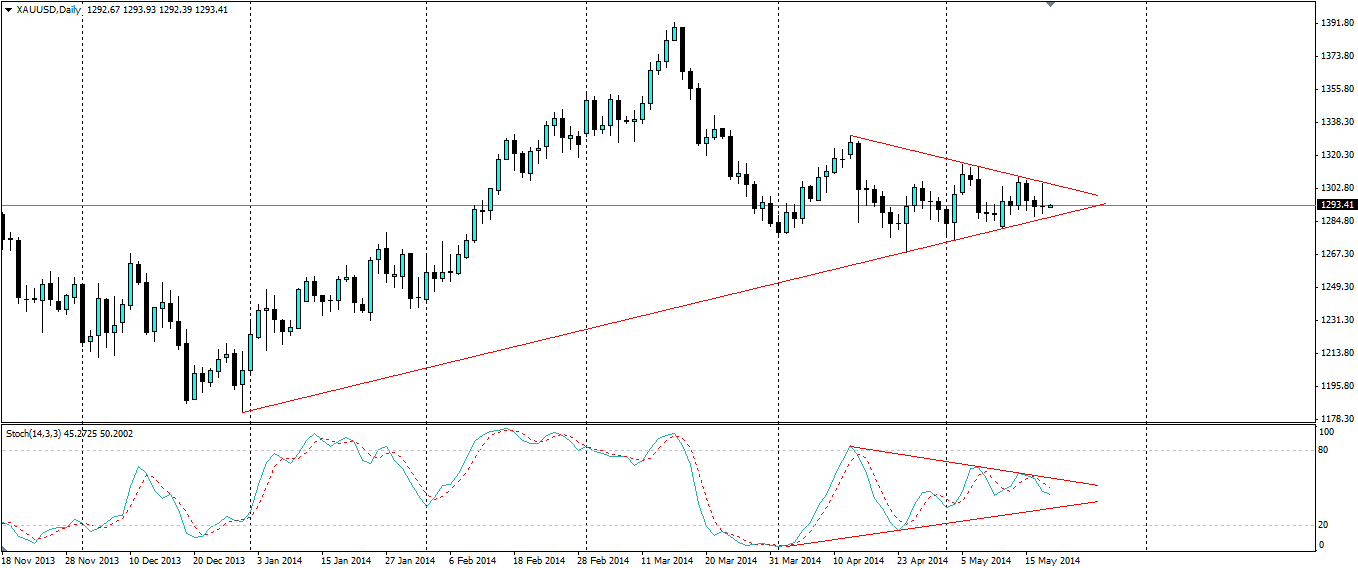
The Stochastic Oscillator is still showing convergence of the momentum. It has levelled out slightly but is still lacking direction and is posting higher lows and lower highs. This is confirming what we already know about the squeeze in volatility. A breakout here could signal to the market which way momentum is swinging.

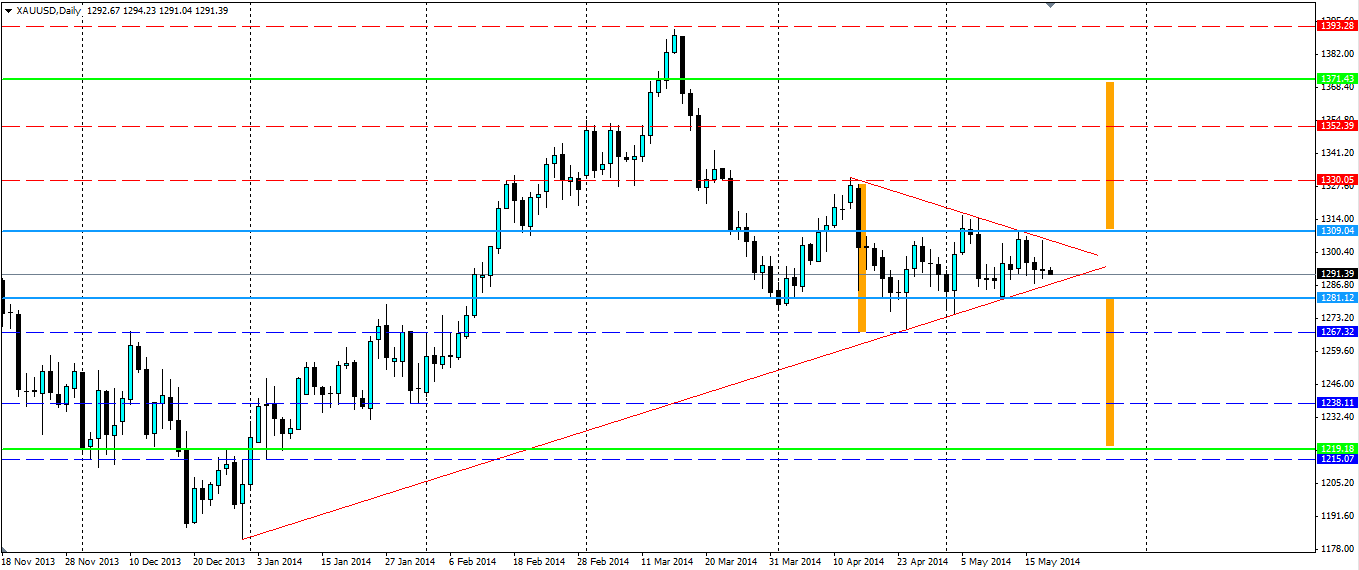
The most logical way to trade a breakout of the price consolidation would be to wait for one of the Bollinger Bands to be breached. At present, the upper band is at 1309.04 so a stop buy can be set here. The lower band is at 1281.12 so a stop sell can be set here to enter if the price breaks below.
The rule of thumb with pennants is for the target to be a function of the width of the first wave of the shape. In this case, bearish movement from 14th to 24th of April is approximately $62.00 (shown in orange). So our targets should be $62 away from our entry points. In the case that price breaks to the up side, we should set a target around the $1,371 mark. Alternatively, the downside target should be the $1,219mark.
The risk of following this rule is that the price might get stuck at some of the resistance or support levels found on the way to these targets (shown as dashed lines below), particularly the $1330.05 for the up side and $1,238.11 for the downside. One way to mitigate the risk is to partially close an order once these levels are reached, or maintain a trailing stop loss so profits can be locked in if the price moves against us. Traders should manage their own risk with their own risk profiles.

The Gold price is being squeezed into an ever narrowing shape which has primed it for an explosive breakout. Any movement outside of the narrow Bollinger Bands ® will signal to the market which way the movement is and traders can take advantage of this.
