
The yellow metal surged higher this week trading up to its highest level since July fuelled by safe haven demand. The collapse across global equity markets this week has triggered a seismic shift in risk appetite which has favored gold, traditionally used as a store of value during times on financial market volatility and economic uncertainty.
There doesn’t seem to be a specific driver behind the moves, more a combination of factors including ongoing uncertainty around the US / China trade war, a potential slow down in China as well as Brexit concerns and higher US rates.
While the moves in gold have been dramatic, we are seeing some recovery in equity markets today which should cap gold gains for now. Looking further out, the prospect of further US rate hikes should contain medium-term gold upside with the Fed on course to raise rates again in December.
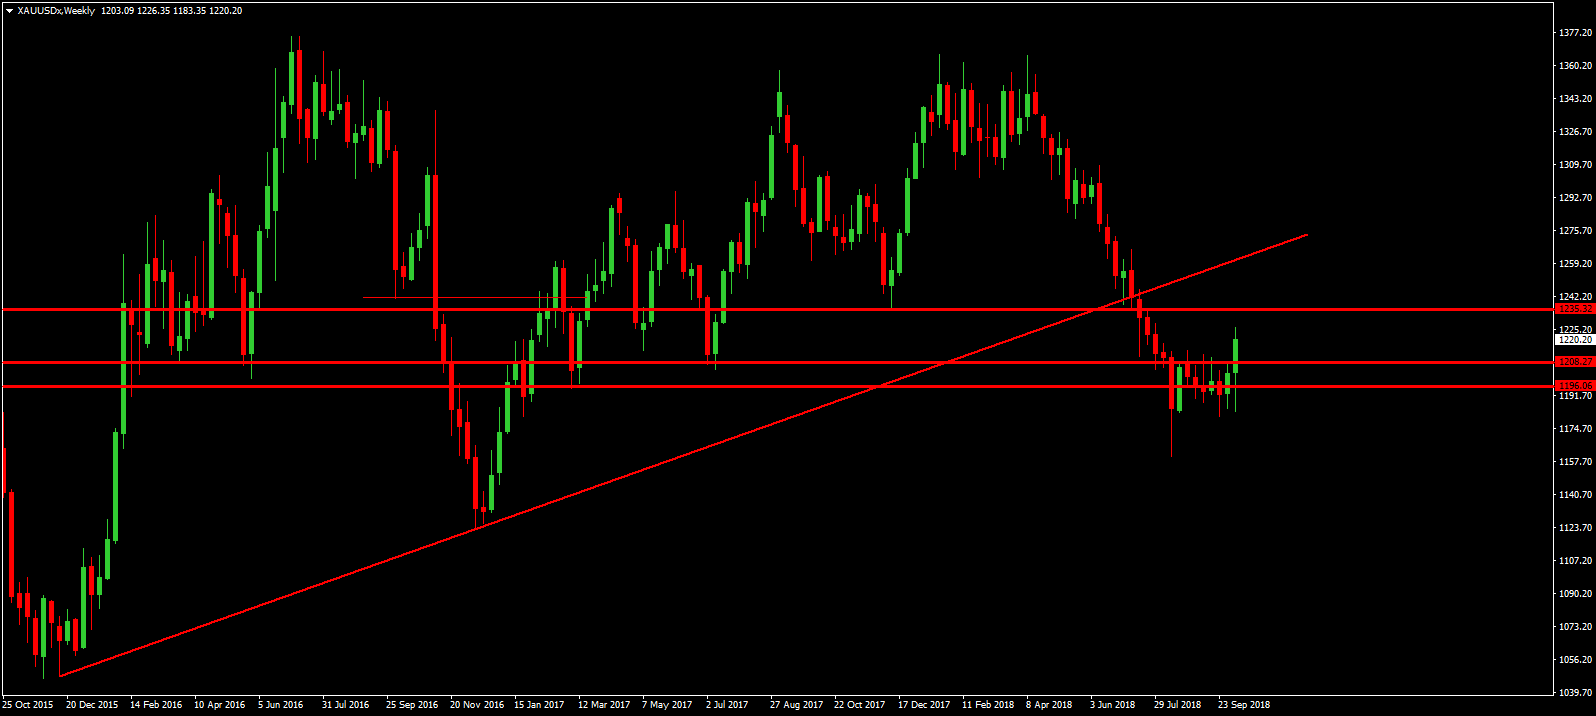
The rally in gold prices this week has seen price breaking out above the recent block of consolidation which had stifled price action. The focus will now be on a test of the next structural resistance at the 1235.32 level which was the December 2017 low. Above here and focus will be on a retest of the broken bullish trend line from 2015.
Silver prices broke their correlation with gold this week and traded lower despite the dramatic upside seen in gold. Silver, which often tracks equity prices due to its industrial uses, was moved lower by the massive sell-off seen across US equities markets. The S&P500 hit its lowest level since June before rebounding slightly.
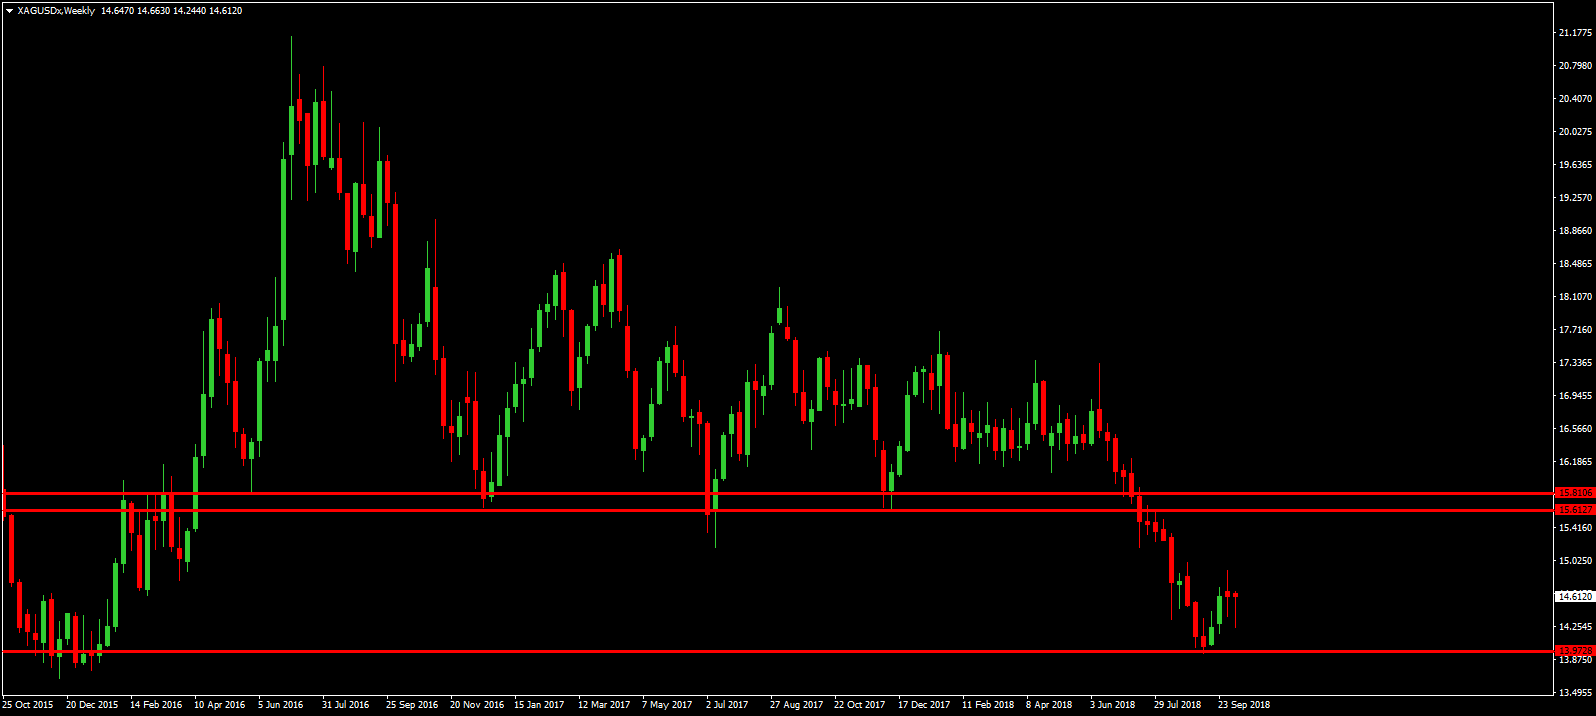
Silver prices are still sitting above the 2015 lows which have acted as support for now. Focus remains on further downside unless the market can build any topside traction. Above here, the key resistance level to watch is the 15.61 – 15.81 region which was a significant support zone over the last two years and has yet to be retested after being broken earlier this year.
Despite the strong wave of risk aversion ripping across markets, the red metal was actually higher over the week as bulls were encouraged by solid Chinese import data. The world’s largest copper buyer reported that its monthly imports were near record levels last month in the wake of having tightened waste related imports earlier in the year.
However, the outlook for copper is not too good given the ongoing trade war between the US and China. Furthermore, China also reported an unexpected surge in exports last month as well as a record trade surplus with the US which will no doubt exacerbate trade tensions between the two economic superpowers.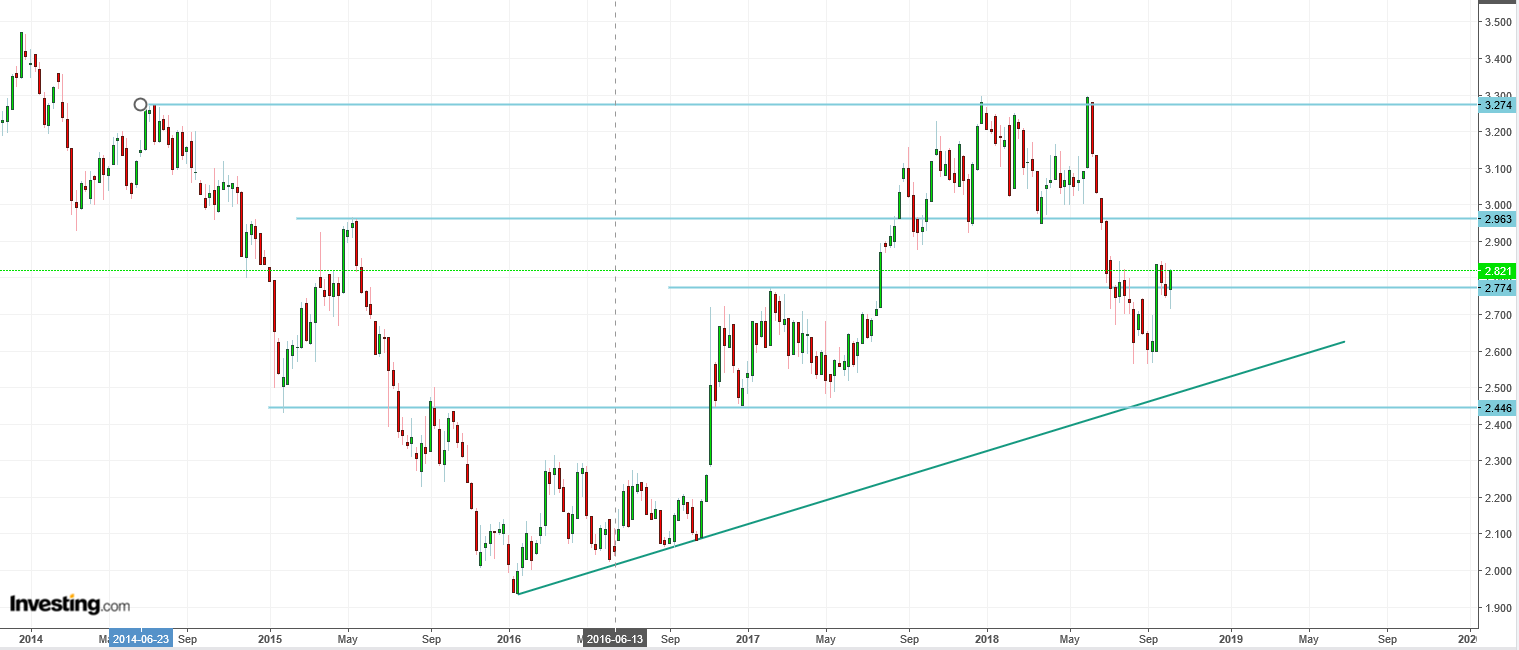
The rebound in copper this week has taken price back above the 2.774 level which is now acting as support. While above this level, the focus is on a further upside rotation with the 2.963 level the next key resistance level to watch. To the downside, the main support is seen along the rising trend line from 2016 lows.
Despite the weakness in Chinese and global equity markets this week, Iron ore prices surged to their highest levels since March as traders reacted to news of temporary steel production cuts in the city of Tangshan, China’s most significant steel producing region.
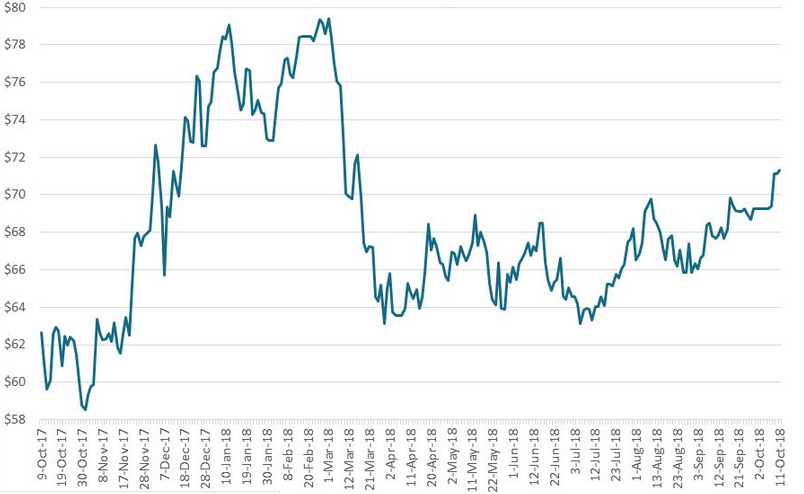
The moves in iron ore prices this week have seen the metal finally breaking out of the range which has persisted since late March. After several attempts on the $68 – $70 resistance level, iron ore has finally broken out and is now on course to test the next key resistance of $72. To the downside, any retest of the broken $70 should find support.