While stocks, futures and other non-physical assets are getting riskier every day, gold has always been considered a safe-haven asset. Even though seeing a downtrend these days due to low inflation in major developed economies, gold is still one of the major commodities for traders and investors worldwide.
UBS Investment Resarch has downgraded its forecast for the average price of gold down to $1200 per troy ounce. They say since early 2014, traders and investor will start abandoning gold for riskier assets with higher profitability.
On December 15th, Bank of America claimed that the average price of gold in 2014 will be around $1294/oz, thereby rising from $1250 in Q1 up to $1350 in Q4.
Morgan Stanley's forecast is bearish as well. The experts say gold will continue losing value in 2014 amid the Fed's QE tapering efforts. The bank's average estimation is $1313/oz.
Goldman Sachs made the gloomiest forecast for gold. In particular, the bank expects gold to devalue down to $1050/oz in 2014.
Gold Prices in 2014
Other experts seem to have the opposite standpoint. The experts predict higher gold price in 2014 as the crisis escalates. For example, Jim Stincler expects $2400 per troy ounce of gold by the end of 2014.
Some more conservative guys expect $1600-16800 per troy ounce.
As far as independent experts are concerned, long-term forecasts for gold are ineffective since the market is subject to strong speculative tendencies while major market participants can move the price in the desired direction against all solid forecasts.

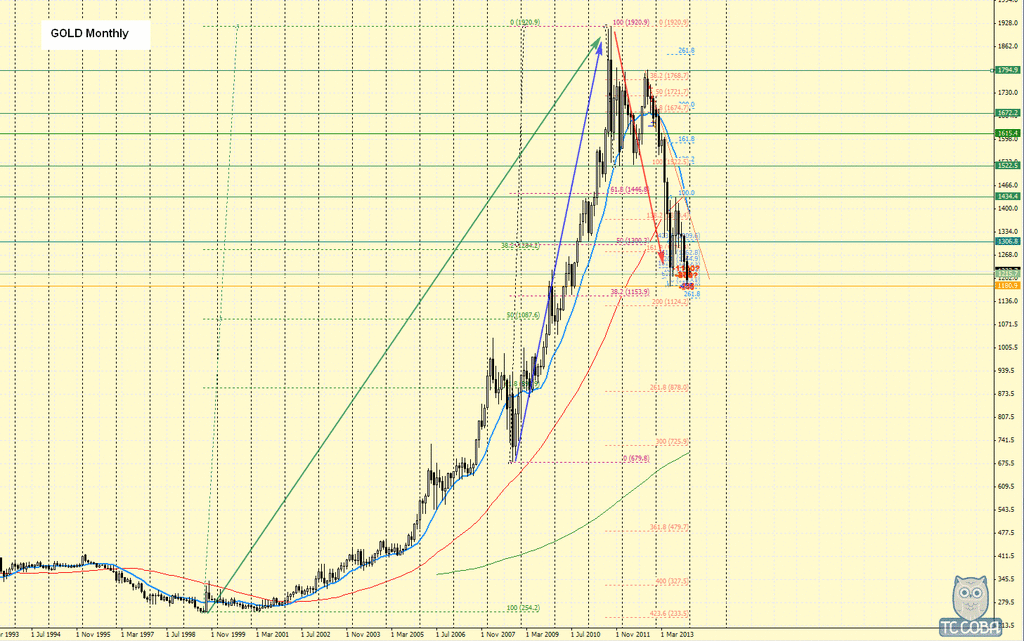
The chart embraces the period from 195 till 2013. In 1998-2001, the price moved within a relatively narrow price range. 2001-2011 is the booming period showing a strong rally. During the period, the price gained 800% after nearing $2000/oz. The price has been declining ever since but the retracement hasn't still reached the 50% retracement from the green wave – 1087.6.
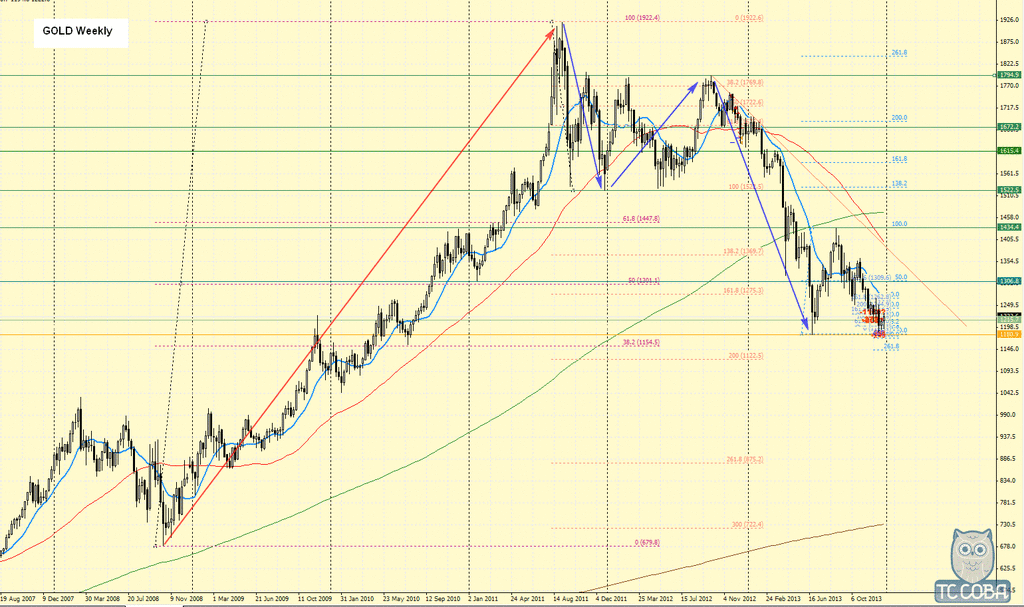
The chart below shows the weekly timeframe, which indicates the mentioned movement form the 1922.4 all-time high in more detail.
The 3-wave pattern (blue lines) inside the downswing has hit 1180.9. There are other major price levels below - 1154.5 (38.2% of the red upswing) and 1122.5 (200% of the first blue downswing).
It is important to pay attention to the price reaction to 1.522.5-1794.9, the range of the 2nd blue wave.
The upward scenario will manifest itself if the price breaks through these levels. This will indicate the desire to retest the all-time high in the long run.
The 3rd blue wave has the strongest pace of decline since 2011. The downward targets are
1087.6, 1005.9.
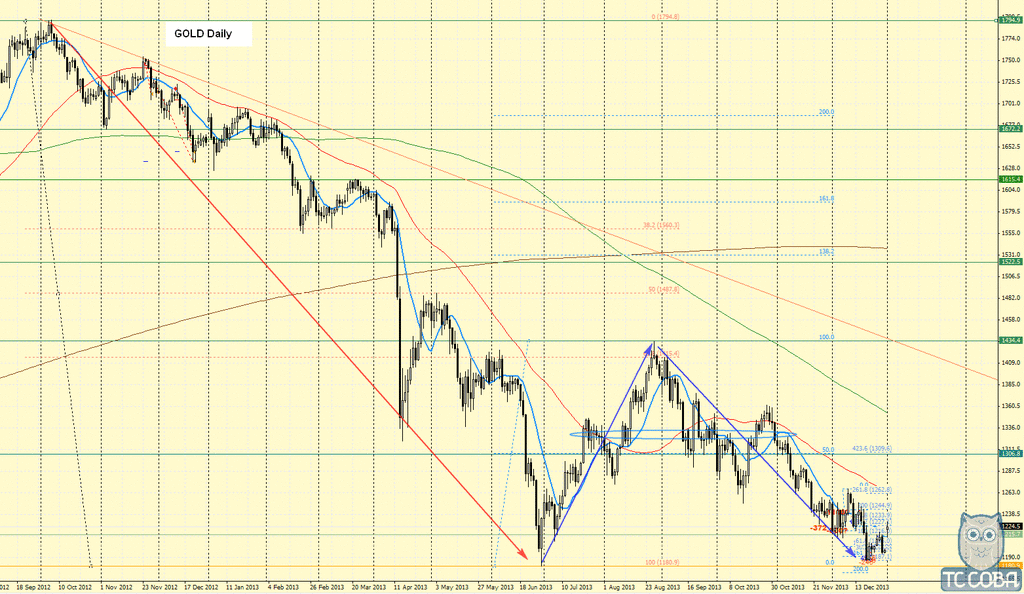
The next chart is Daily. The price move since July 2013 looks especially interesting.
The downswing (the red line) includes 2 April days of the last year when the price passed 2300 points. This was a collapse from 1645,6 down to 1335.8.
Those traders who opened their trades just in time for the big collapse managed to capture quarterly gains in a couple of days.
The recovery started in July 2013. This may be the beginning of an upward reversal. If this is the case, we will see another (3rd) blue wave with targets around 1531 and 1600. The scenario will manifest itself if the price consolidates above 1263 and 1330.
On the other hand, a break below 1180.9 will indicate a further downtrend with targets around 1087.6, 1005.9.
More specific targets can be calculated on smaller-scale timeframes like H1-H4.
