On Jan. 29, 2019, we issued a research post indicating we believed that precious metals would rotate lower over the next 45+ days in preparation for a momentum base/breakout that would initiate sometime near the end of April or early May.
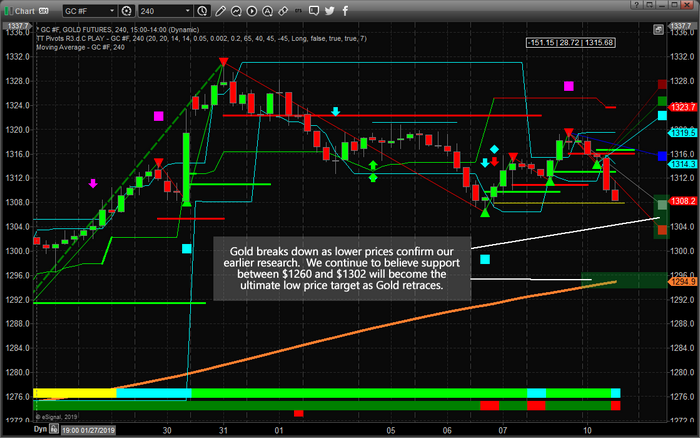
Recent price weakness in gold has begun to confirm our analysis and we believe this price weakness will continue for the next 2~4 weeks while traders identify a price bottom and hammer out a momentum base/support level.
The yellow metal is currently down another -1% this week and testing the $1307 level after rotating back to near $1320. Our analysis continues to suggest price weakness in the precious metals markets going forward for at least 2~3 more weeks.
We are expecting the price of gold to fall below $1290 and ultimately, potentially, test the $1260 level where we believe true support will be found.
This 240-minute gold chart highlights our Adaptive Fibonacci price modeling system and suggests the $1295~1302 could become immediate support for this current downside price move.

