We saw a surprisingly strong rally in gold on Friday, given that it had broken down below strong support only a week before – it rose about $37 on strong volume.
In this update we are going to define downside targets for gold, and also look at what it would take technically to signal a reversal and turn the picture immediately bullish.
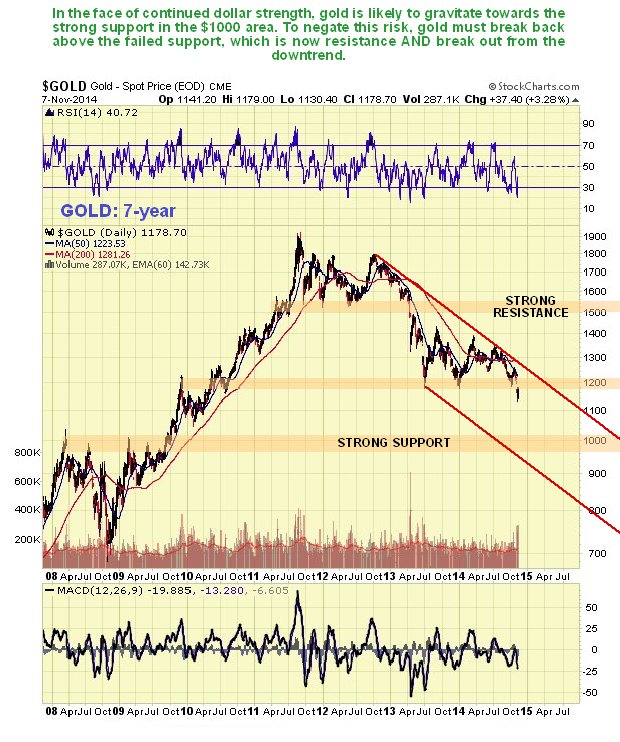
On gold’s 7-year chart we see that the breach of strong support at last year’s lows over a week ago calls for another downleg within the downtrend channel shown, at least to the $1000 area where is particularly strong support, and possibly lower still to the $850 - $900 area in the event that gold drops to contact the lower boundary of the channel again. Given the strength of the support shown in the $1000 area there is a good chance that it will bottom here.
What would it take to negate these scenarios and turn the picture immediately positive? That is easy to define – to turn the picture bullish, gold has to get back above the recently failed support AND above the upper boundary of the downtrend channel. Latest COTs indicate that there is some chance it will do this.
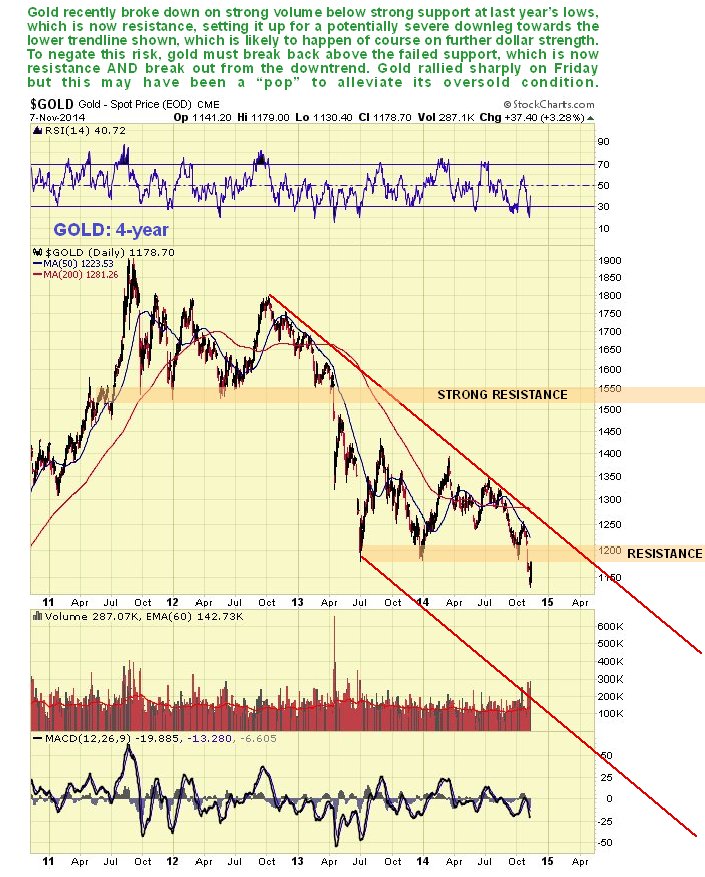
The 4-year chart enables us to see the large trading range that formed from the middle of last year in more detail, and the breakdown over a week ago in the context of this pattern. Although gold made an impressive “pop” on Friday, it will be tough for it to get back above the failed support that is now a resistance level.
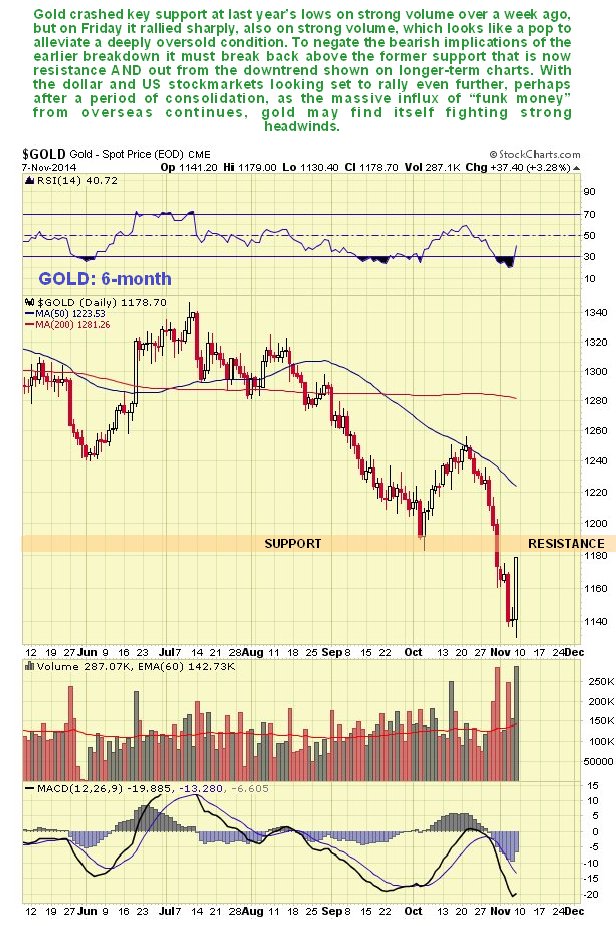
On the 6-month chart we can see the breakdown below support in detail and how Friday’s sharp rally has brought it back up quite close to the breakdown point. The next week or two will be important – will it break back above the former support that is now resistance – or reverse and head south again? Latest COTs suggest that gold is in with a chance, so it will be very important how these evolve early next week – if the Commercials pile on the shorts again early next week, then gold will back off and go into retreat again – but we won’t know what they have done until the next report is released next Friday, as usual.
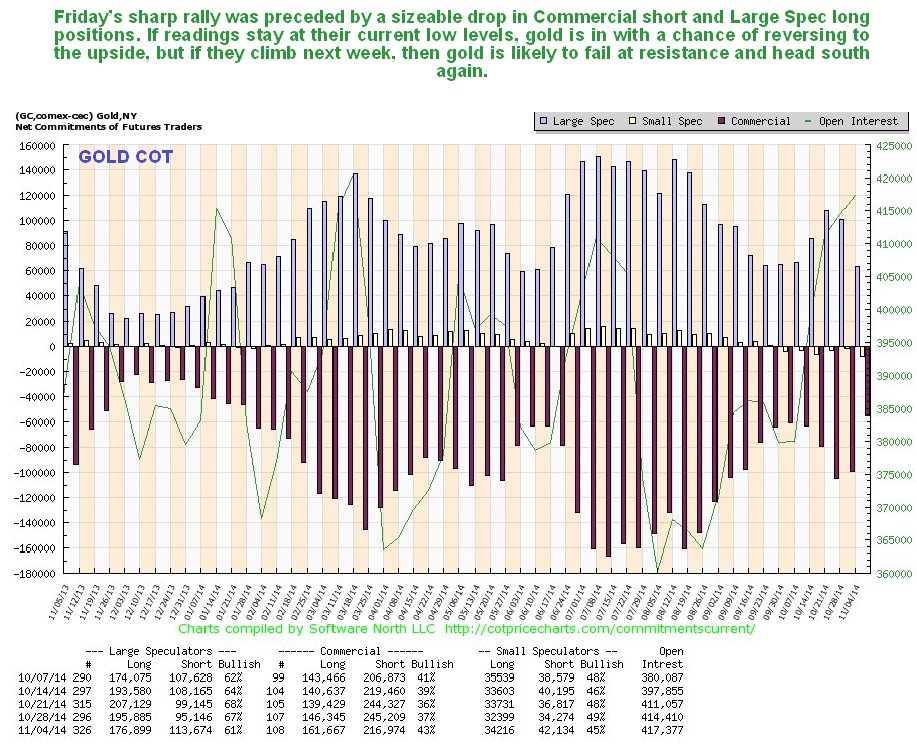
The new COTs shown below reveal that there was a rather dramatic drop in Commercial short and Large Spec long positions last week, which preceded Friday’s rally – now you know why in this age of instant communication they take 3 days to release this information – by the time the ordinary investing public get it, it’s quite often too late to do anything about it.
This latest gold COT looks bullish, but it won’t stop gold dropping back again if the Commercials pile on the shorts again early next week (and the Large Specs the longs).
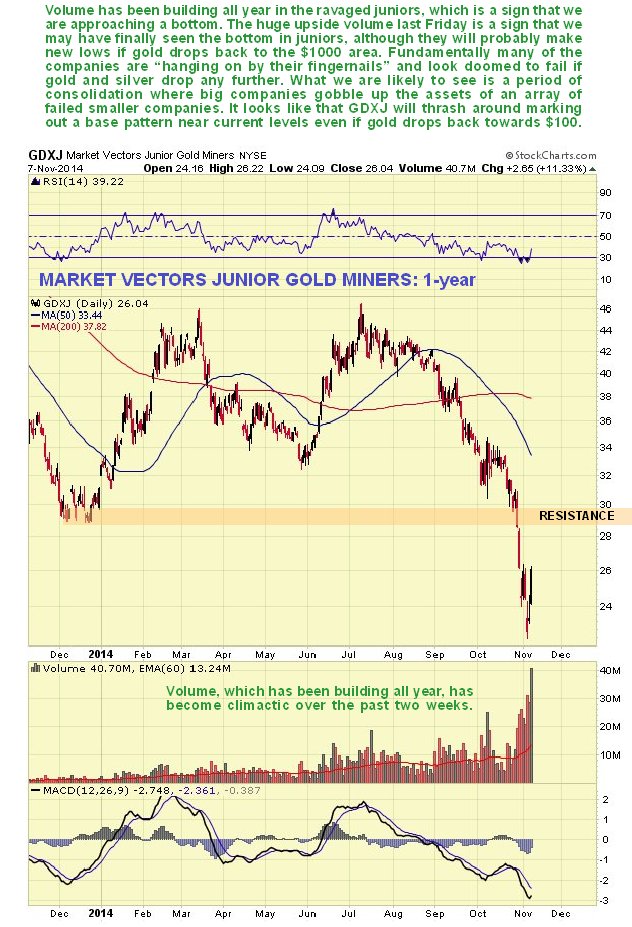
The chart for the Market Vectors Junior Gold Miners (ARCA:GDXJ) ETF makes fascinating viewing. On its 1-year chart we can see that it crashed a key support level and plunged on record volume towards the end of October, but on Friday it rallied strongly on new record volume. Volume has been rising in this all year, and we have seen record volume up days several times, but every time it has proved to be a “false dawn”, with GDXJ subsequently dropping to new lows.
That may be the case this time, however, volume is now rising to such extraordinary levels that it is a sign that we are close to a final bottom in this, which is likely to occur just as many juniors shut up shop, and the sharks (big companies, asset strippers etc) move in for the feeding frenzy, gobbling up the assets of the deceased.
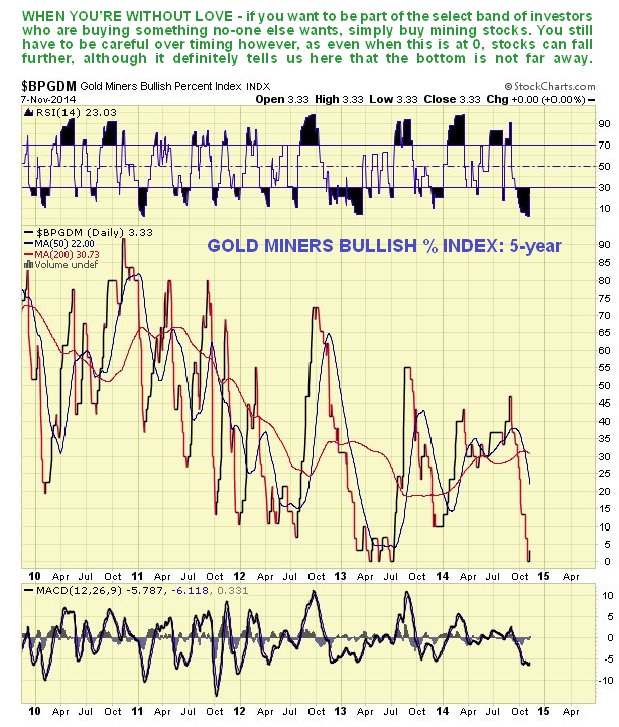
The current dismal reading of the Gold Miners Bullish Percent Index, which hit zero last week—a rare event—before bouncing on Friday, tells us that while we may not be at the bottom, it is not far away. If gold succeeds in breaking out of its downtrend then we are at the bottom here, if it drops to the $1000 area, stocks are likely to drop further, but also look set to front run the bottom in the metals.
One thing is clear from this chart and the one above for GDXJ, we are close to the final bottom in PM stocks, even if we see some further downside near-term.
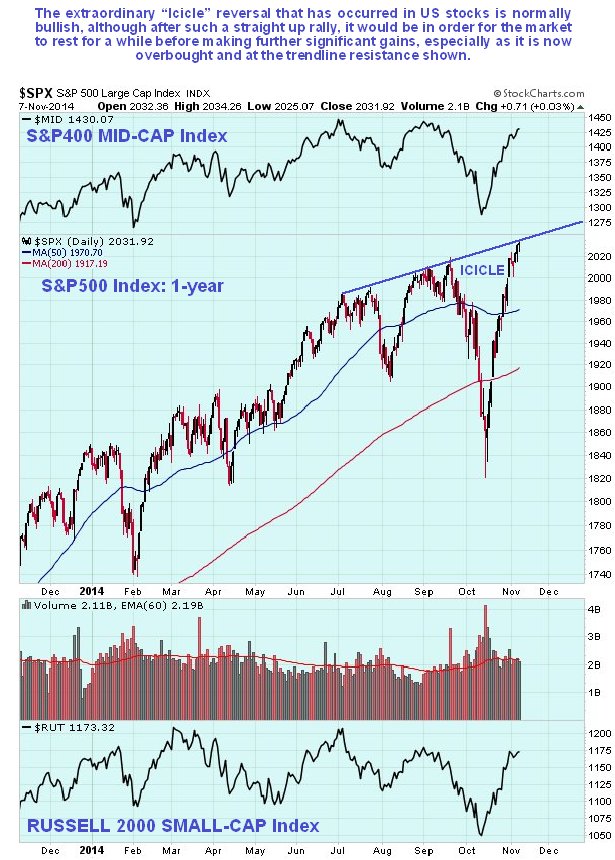
The course of the dollar has a critical bearing on the outlook for the gold price as ever. If we go on normal sentiment indicators etc, the dollar looks likely to reverse here or soon, but the extraordinary influx of capital into the US from the rest of the world may continue, as money flees deflation wracked and politically crippled Europe, and the Mid East which feels under threat as never before from fundamentalist elements, and also other troubled places around the globe, seeking relative safe haven.
In this situation the rising dollar and rising US stock market bolster each other in a positive feedback loop, since investors not only see nominal rises in the price of their better quality stocks, but see their gains bolstered by a rising dollar, which makes them want into the market even more. This is why the dollar could rise more than many think possible, and remains a serious threat to gold and silver prices.
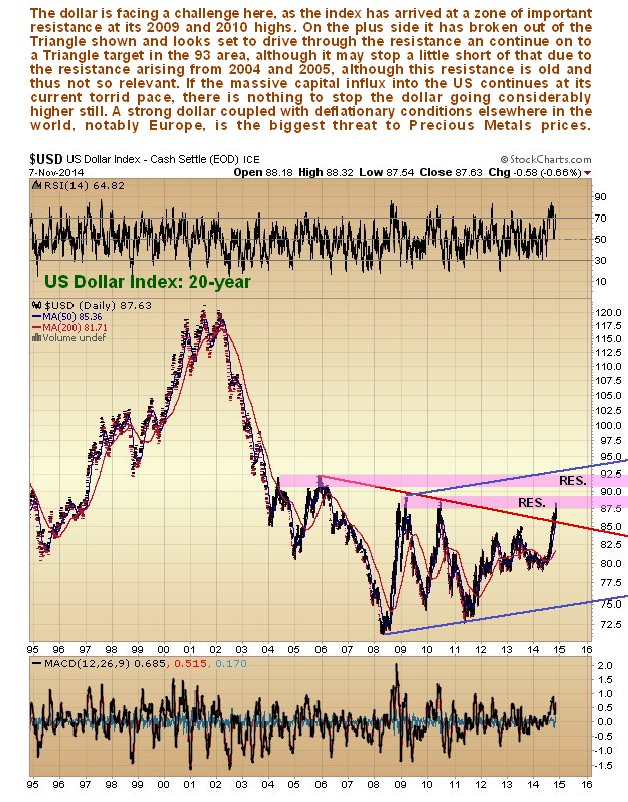
The 20-year chart for the dollar index enables us to see the recent strong dollar rally in the context of its gyrations over many years. The first thing it makes clear is that the move, although impressive, is not exceptional – it can and has done much more.
While COTs and sentiment indicators suggest that it could top out in the resistance zone that it has now entered—between the current value and about 89—there is scope for it to advance further to the next resistance level in the 91 – 92 area, which is the target suggested by the recent Flag, best seen on short-term charts. And it could possibly make it as far as the Triangle target in the 92.50 - 93 area.
In extreme circumstances the entire pattern from 2004 could turn out to be a giant base area that could support an eventual advance to the 120 area, which would really put the cat amongst the pigeons, and would be the occasion for US citizens to indulge themselves in a foreign vacation, providing that you still have permission to leave the country by that time, of course.
Conclusion – the recent support failure points to gold dropping to strong support in the $1000 area, with the possibility of it dropping further to arrive at the lower boundary of its downtrend channel in the $850 - $900. The current rally back towards the breakdown point is a normal occurrence that is usually followed by renewed decline. To avert this bearish scenario, gold needs to rally not just back above the recent failed support at last year’s lows at about $1180, but also sufficient to break it out decisively from its downtrend channel in force from October 2012, whose upper boundary is currently at about $1270. Current COTs and sentiment do support such a development, but these may be overridden temporarily by other factors.
